HOT TOPICS LIST
- MACD
- Fibonacci
- RSI
- Gann
- ADXR
- Stochastics
- Volume
- Triangles
- Futures
- Cycles
- Volatility
- ZIGZAG
- MESA
- Retracement
- Aroon
INDICATORS LIST
LIST OF TOPICS
PRINT THIS ARTICLE
by Gary Grosschadl
The world's largest chip maker has a hefty problem regarding its current daily chart: It's in bear land.
Position: Sell
Gary Grosschadl
Independent Canadian equities trader and technical analyst based in Peterborough
Ontario, Canada.
PRINT THIS ARTICLE
CHART ANALYSIS
Intel's Big Problem
02/01/05 08:36:08 AMby Gary Grosschadl
The world's largest chip maker has a hefty problem regarding its current daily chart: It's in bear land.
Position: Sell
| One of the single most important tools that is often used by traders and fund managers alike is the answer to a simple question: Is the stock above or below its 200-day moving average (MA)? Many conservative or discerning traders/investors/managers will simply not consider any stock that is in "bear land." The trend is your friend. Stocks above their 200-period moving averages are in a bullish trend and stocks below this important marker are deemed to be in a bearish trend. Yes, this can be an oversimplication because there are trends within trends, but the best rules are often the simplest ones. |
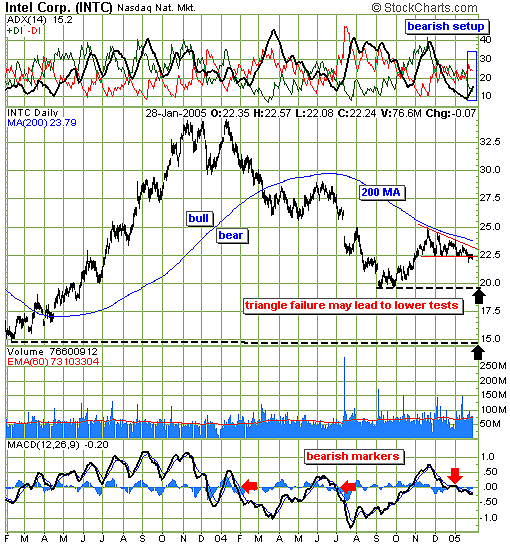
| Traders who accumulated this stock as it first broke above its overhead 200-day moving average in spring 2003 have seen their investment double in less than nine months, an exceptional return. Not many can exit near the top, but even if the trader decided to hold until the 200-day MA was broken to the downside, the gain was still near $10 ($18 to $27.50). |

|
| Figure 1: Intel remains in bear land while below its 200-day MA. |
| Graphic provided by: StockCharts.com. |
| |
| Using the 200-day MA as a simple harbinger of stock health, the same trader has not reentered a buy position as the stock cannot muster enough power to thwart the overhead resistance of this prominent moving average. |
| Looking at this current chart, we could argue there are more reasons to short this stock than to go long. Witness the descending triangle that appears to be breaking down. Should bearish power continue, the next two significant support areas represent previous lows near $20 and $15. Two indicators also show bearish concerns. The directional movement indicator at the top of the chart shows the classic bearish setup: bearish trend strength increasing (rising average directional movement index [ADX]) with bearish power dominating (-DI above +DI). The second displayed indicator is the MACD, or moving average convergence/divergence. Bearish trend strength increases when this indicator dips below its zero line. Note the previous downlegs that occured as a result, and now we have a similar situation. This may be pointing to another downleg beginning. |
| In summary, it is not safe to enter this stock until the 200-day MA is broken to the upside with conviction. Until this happens, Intel has a big chip on its shoulder. |
Independent Canadian equities trader and technical analyst based in Peterborough
Ontario, Canada.
| Website: | www.whatsonsale.ca/financial.html |
| E-mail address: | gwg7@sympatico.ca |
Click here for more information about our publications!
Comments
Date: 02/01/05Rank: 5Comment:
Date: 02/05/05Rank: 5Comment:
Date: 02/13/05Rank: 2Comment: what about resistance ?
The 200MA is aout to be crossed, and this could be a bullish signal.
This article is simplified TA, so simplified that it s very confusing.

Request Information From Our Sponsors
- StockCharts.com, Inc.
- Candle Patterns
- Candlestick Charting Explained
- Intermarket Technical Analysis
- John Murphy on Chart Analysis
- John Murphy's Chart Pattern Recognition
- John Murphy's Market Message
- MurphyExplainsMarketAnalysis-Intermarket Analysis
- MurphyExplainsMarketAnalysis-Visual Analysis
- StockCharts.com
- Technical Analysis of the Financial Markets
- The Visual Investor
- VectorVest, Inc.
- Executive Premier Workshop
- One-Day Options Course
- OptionsPro
- Retirement Income Workshop
- Sure-Fire Trading Systems (VectorVest, Inc.)
- Trading as a Business Workshop
- VectorVest 7 EOD
- VectorVest 7 RealTime/IntraDay
- VectorVest AutoTester
- VectorVest Educational Services
- VectorVest OnLine
- VectorVest Options Analyzer
- VectorVest ProGraphics v6.0
- VectorVest ProTrader 7
- VectorVest RealTime Derby Tool
- VectorVest Simulator
- VectorVest Variator
- VectorVest Watchdog
