HOT TOPICS LIST
- MACD
- Fibonacci
- RSI
- Gann
- ADXR
- Stochastics
- Volume
- Triangles
- Futures
- Cycles
- Volatility
- ZIGZAG
- MESA
- Retracement
- Aroon
INDICATORS LIST
LIST OF TOPICS
PRINT THIS ARTICLE
by Gary Grosschadl
It's been a healthy three-month climb, but all is not well now with the chart.
Position: Sell
Gary Grosschadl
Independent Canadian equities trader and technical analyst based in Peterborough
Ontario, Canada.
PRINT THIS ARTICLE
CHART ANALYSIS
How Healthy Is First Health Group Corp.?
02/01/05 08:23:17 AMby Gary Grosschadl
It's been a healthy three-month climb, but all is not well now with the chart.
Position: Sell
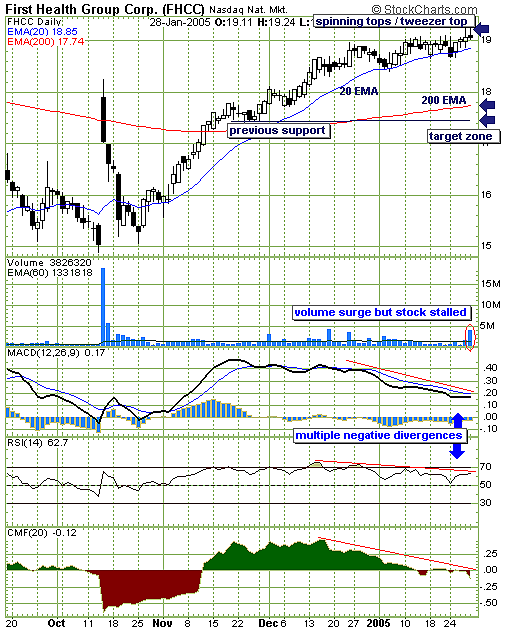
| This daily chart of First Health Group (FHCC) warrants taking a closer look, especially for traders holding profits. At first glance, it is apparent this stock's recent climb has had excellent support from its 20-day exponential moving average (EMA). However, early symptoms are appearing that traders should be keeping in mind. |
| Recent candlestick formations, coupled with several indicators, hint at this stock being stalled and soon ready to correct. After moving sideways for three weeks, two back-to-back spinning tops have emerged, forming a possible tweezer top pattern. Spinning tops with their diminutive bodies and tails on both ends point to a tug-of-war between bulls and bears. These last two candlesticks have formed a tweezer top with the two pincher-like top shadows. This is a possible top warning showing how the bulls could not close at the top of the trading range. Note the surge in trading volume, but the stock seems stalled here. Traders could be bailing as they begin to realize that the bulls can no longer sustain the previous advance. |

|
| Figure 1: FHCC. Daily chart suggests the stock may have stalled and soon ready to follow the indicators south. |
| Graphic provided by: StockCharts.com. |
| |
| Technical traders will no doubt have noted that several serious multiple negative divergences have emerged that will likely affect this stock very soon. As FHCC has been struggling sideways and finally has risen above the $19 barrier, three noteworthy indicators have been sliding south. When indicators go contrary to price action, something is out of whack and more often than not, it is the price action that eventually corrects. Of the three indicators shown, of particular concern is the Chaikin money flow indicator (CMF). Not only has buying power dried up, it has plummeted. With virtually no buying power left, who will move the stock higher from here? Power is likely shifting hands here, and the tug of war is likely to be won by the bears as the bulls start to flee, as suggested by the volume surge. |
| The suggested downside target is the area of the 200-day EMA and a previous support zone. This 200-period EMA is often a trading target, as short-term traders look to anticipate a tradable support level. Being near a previous support level from last November, this area -- 17.40 to 17.80 -- is a reasonable trading target. Failure there could return the stock to $16 as a lower support level. |
| In summary, some downside action is anticipated, with multiple closes below the supporting 20-day being the first step. A surprise move above the tweezer top would negate this bearish scenario; time will tell soon enough. |
Independent Canadian equities trader and technical analyst based in Peterborough
Ontario, Canada.
| Website: | www.whatsonsale.ca/financial.html |
| E-mail address: | gwg7@sympatico.ca |
Click here for more information about our publications!
Comments
Date: 02/05/05Rank: 4Comment:

Request Information From Our Sponsors
- StockCharts.com, Inc.
- Candle Patterns
- Candlestick Charting Explained
- Intermarket Technical Analysis
- John Murphy on Chart Analysis
- John Murphy's Chart Pattern Recognition
- John Murphy's Market Message
- MurphyExplainsMarketAnalysis-Intermarket Analysis
- MurphyExplainsMarketAnalysis-Visual Analysis
- StockCharts.com
- Technical Analysis of the Financial Markets
- The Visual Investor
- VectorVest, Inc.
- Executive Premier Workshop
- One-Day Options Course
- OptionsPro
- Retirement Income Workshop
- Sure-Fire Trading Systems (VectorVest, Inc.)
- Trading as a Business Workshop
- VectorVest 7 EOD
- VectorVest 7 RealTime/IntraDay
- VectorVest AutoTester
- VectorVest Educational Services
- VectorVest OnLine
- VectorVest Options Analyzer
- VectorVest ProGraphics v6.0
- VectorVest ProTrader 7
- VectorVest RealTime Derby Tool
- VectorVest Simulator
- VectorVest Variator
- VectorVest Watchdog
