HOT TOPICS LIST
- MACD
- Fibonacci
- RSI
- Gann
- ADXR
- Stochastics
- Volume
- Triangles
- Futures
- Cycles
- Volatility
- ZIGZAG
- MESA
- Retracement
- Aroon
INDICATORS LIST
LIST OF TOPICS
PRINT THIS ARTICLE
by Gary Grosschadl
After the gold runup of last year, this precious metal has lost some of its luster. How much more downside can we expect?
Position: Sell
Gary Grosschadl
Independent Canadian equities trader and technical analyst based in Peterborough
Ontario, Canada.
PRINT THIS ARTICLE
DOUBLE TOPS
Gold Losing Luster
01/31/05 11:42:17 AMby Gary Grosschadl
After the gold runup of last year, this precious metal has lost some of its luster. How much more downside can we expect?
Position: Sell
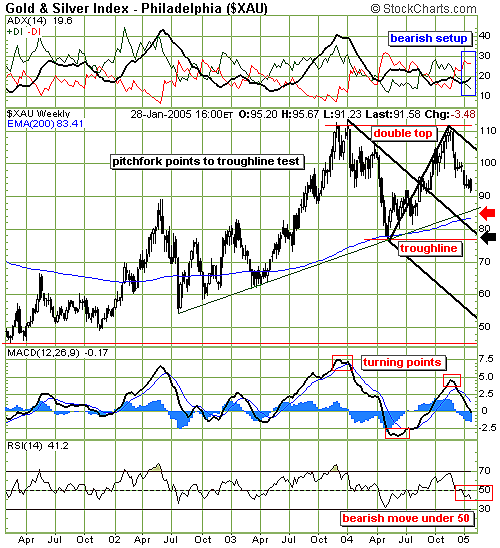
| This weekly chart of the XAU (Philadelphia Gold & Silver Index) shows two patterns that point to more possible downside ahead. There could be a possible double top in the making and a bearish-pointing Andrews pitchfork. |
| A true double top is characterized by a failure of the troughline, which leads to further downside. If this patterns fulfills to completion, the ultimate downside target is 45, which would be a multiyear low. A more likely scenario would be a troughline test at or near 77. |

|
| Figure 1: XAU. Weekly chart of a popular gold and silver index, the XAU. |
| Graphic provided by: StockCharts.com. |
| |
| The pitchfork drawn on the chart also suggests a test of that same troughline region. The pitchfork is anchored by three significant turning points, and pitchfork theory holds that 80% of the time, when a valid pitchfork is drawn, there will be a move to the median line before a possible bounce occurs. Under super bear/bull conditions, the move may continue to the extreme outer limit of the pitchfork. Note the close proximity of the median line and the double-top troughline. This implies a likely strong level of support and bounce probability at or near 77. |
| It is worth noting that a higher level of support may be offered by a multiyear trendline, being close to the 200-period exponential moving average (EMA). A pause here could occur as traders ponder bounce possibilities. |
| Three indicators also show bearish promise ahead. The directional movment indicator at the top of the chart is showing a growing bearish sentiment. The average directional movement index (ADX) component is upsloping and building bearish trend strength. The moving average convergence/divergence (MACD) is downtrending after completing its own bearish cross and going under the zero line would add bearish power. The relative strength index (RSI) also shows bearish overtones by falling below its key 50 level. Traders should be alert for signs of a possible tradable bounce between 77 and 84. |
Independent Canadian equities trader and technical analyst based in Peterborough
Ontario, Canada.
| Website: | www.whatsonsale.ca/financial.html |
| E-mail address: | gwg7@sympatico.ca |
Click here for more information about our publications!
Comments
Date: 02/01/05Rank: 5Comment:
Date: 02/02/05Rank: 4Comment:
Date: 02/05/05Rank: 4Comment:

Request Information From Our Sponsors
- StockCharts.com, Inc.
- Candle Patterns
- Candlestick Charting Explained
- Intermarket Technical Analysis
- John Murphy on Chart Analysis
- John Murphy's Chart Pattern Recognition
- John Murphy's Market Message
- MurphyExplainsMarketAnalysis-Intermarket Analysis
- MurphyExplainsMarketAnalysis-Visual Analysis
- StockCharts.com
- Technical Analysis of the Financial Markets
- The Visual Investor
- VectorVest, Inc.
- Executive Premier Workshop
- One-Day Options Course
- OptionsPro
- Retirement Income Workshop
- Sure-Fire Trading Systems (VectorVest, Inc.)
- Trading as a Business Workshop
- VectorVest 7 EOD
- VectorVest 7 RealTime/IntraDay
- VectorVest AutoTester
- VectorVest Educational Services
- VectorVest OnLine
- VectorVest Options Analyzer
- VectorVest ProGraphics v6.0
- VectorVest ProTrader 7
- VectorVest RealTime Derby Tool
- VectorVest Simulator
- VectorVest Variator
- VectorVest Watchdog
