HOT TOPICS LIST
- MACD
- Fibonacci
- RSI
- Gann
- ADXR
- Stochastics
- Volume
- Triangles
- Futures
- Cycles
- Volatility
- ZIGZAG
- MESA
- Retracement
- Aroon
INDICATORS LIST
LIST OF TOPICS
PRINT THIS ARTICLE
by David Penn
Swing rule targets in the hourly Standard & Poor's 500 and Nasdaq anticipate a showdown with trend channel support.
Position: N/A
David Penn
Technical Writer for Technical Analysis of STOCKS & COMMODITIES magazine, Working-Money.com, and Traders.com Advantage.
PRINT THIS ARTICLE
SUPPORT & RESISTANCE
The Swing Thing
01/31/05 02:36:47 PMby David Penn
Swing rule targets in the hourly Standard & Poor's 500 and Nasdaq anticipate a showdown with trend channel support.
Position: N/A
| Most of the time when we think about swings in technical analysis, we're talking about swing trading. But back in 1988, trader and technician Stan Weinstein highlighted a technique that he called the "swing rule" that helped him take the measure of market moves. |
| Here's Weinstein's enthusiastic explanation, from his book, SECRETS FOR PROFITING IN BULL AND BEAR MARKETS: "But there is one simple concept that you should be aware of that does have a high degree of accuracy. When you add it to your arsenal of trading tools, you'll really be ready for the firing line. This trading measurement is called the swing rule. It doesn't appear often, but when it does, it can give you real insight into where an advance is likely to end. It's often so accurate that it's almost like reading next week's newspaper today!" |

|
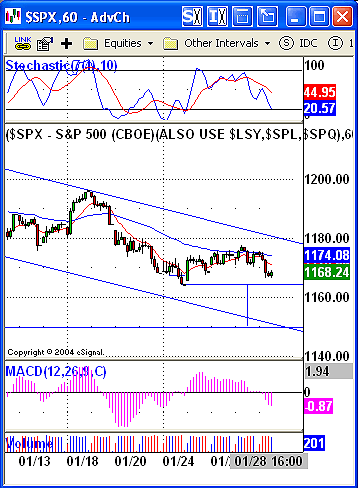
| Figure 1: An application of the swing rule in this chart of the S&P 500 suggests a downside near 1150. |
| Graphic provided by: eSignal. |
| |
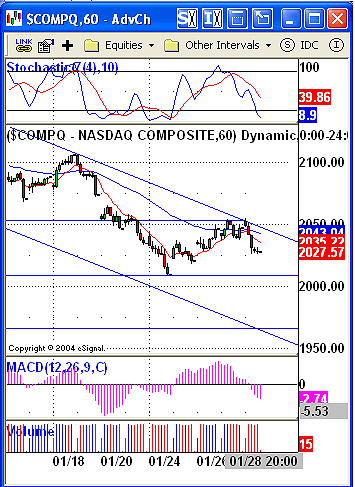
 Figure 2: Should the Nasdaq take out the recent lows, then a swing rule application of the decline points to a downside of 1965. Wow! Some endorsement, eh? What's interesting is that the core notion of the swing rule is--like many tenets of Dow theory have become--already a major part of pattern recognition in technical analysis. Whenever you take the measurement of a head and shoulders top, for example, to determine the likely minimum downside, you are applying the swing rule. The same is true if you are measuring a flag or pennant formation to plot a likely breakout, or looking at a double bottom or double top. |
| Let's look at an example of the swing rule in a downtrend. Simply take the trough price before a significant advance and note the difference between that trough price and the value at the peak of the advance. That difference is then subtracted from the trough price to plot what Weinstein calls "a potential near-term target area." That sounds like a bit of a pullback from the "next week's newspaper today" remark earlier in Weinstein's discussion of the swing rule. But it does conclude by saying "while every swing-rule projection won't turn out to be as perfect as these (examples), the overwhelming majority will be surprisingly on target." |
| Let's look at what the swing rule suggests on the hourly charts of the S&P 500 and Nasdaq. In the case of the S&P 500 in Figure 1, the market made a low at about 1163.75 on January 24, then rallied up to a high of 1177.50 on January 27. This provides for a potential "swing" of 13.75 points. If the market does swing back to the downside by this amount (think of the 1163.75 level as a hinge), then the swing rule suggests a downside of about 1150. Considering the Nasdaq, the scenario is similar (Figure 2). This market made a low of 2009 on January 24, then rallied to a high of about 2053. This creates a potential swing of 44 points, and a potential downside of 1965. |
Technical Writer for Technical Analysis of STOCKS & COMMODITIES magazine, Working-Money.com, and Traders.com Advantage.
| Title: | Technical Writer |
| Company: | Technical Analysis, Inc. |
| Address: | 4757 California Avenue SW |
| Seattle, WA 98116 | |
| Phone # for sales: | 206 938 0570 |
| Fax: | 206 938 1307 |
| Website: | www.Traders.com |
| E-mail address: | DPenn@traders.com |
Traders' Resource Links | |
| Charting the Stock Market: The Wyckoff Method -- Books | |
| Working-Money.com -- Online Trading Services | |
| Traders.com Advantage -- Online Trading Services | |
| Technical Analysis of Stocks & Commodities -- Publications and Newsletters | |
| Working Money, at Working-Money.com -- Publications and Newsletters | |
| Traders.com Advantage -- Publications and Newsletters | |
| Professional Traders Starter Kit -- Software | |
Click here for more information about our publications!
Comments
Date: 02/01/05Rank: 5Comment:
Date: 02/01/05Rank: 5Comment:
Date: 02/01/05Rank: 4Comment:
Date: 02/05/05Rank: 3Comment:

|

Request Information From Our Sponsors
- StockCharts.com, Inc.
- Candle Patterns
- Candlestick Charting Explained
- Intermarket Technical Analysis
- John Murphy on Chart Analysis
- John Murphy's Chart Pattern Recognition
- John Murphy's Market Message
- MurphyExplainsMarketAnalysis-Intermarket Analysis
- MurphyExplainsMarketAnalysis-Visual Analysis
- StockCharts.com
- Technical Analysis of the Financial Markets
- The Visual Investor
- VectorVest, Inc.
- Executive Premier Workshop
- One-Day Options Course
- OptionsPro
- Retirement Income Workshop
- Sure-Fire Trading Systems (VectorVest, Inc.)
- Trading as a Business Workshop
- VectorVest 7 EOD
- VectorVest 7 RealTime/IntraDay
- VectorVest AutoTester
- VectorVest Educational Services
- VectorVest OnLine
- VectorVest Options Analyzer
- VectorVest ProGraphics v6.0
- VectorVest ProTrader 7
- VectorVest RealTime Derby Tool
- VectorVest Simulator
- VectorVest Variator
- VectorVest Watchdog
