HOT TOPICS LIST
- MACD
- Fibonacci
- RSI
- Gann
- ADXR
- Stochastics
- Volume
- Triangles
- Futures
- Cycles
- Volatility
- ZIGZAG
- MESA
- Retracement
- Aroon
INDICATORS LIST
LIST OF TOPICS
PRINT THIS ARTICLE
by David Penn
A symmetrical triangle develops during the course of the downtrend in RKH. Is an upside breakout any more or less likely than a downside breakdown?
Position: N/A
David Penn
Technical Writer for Technical Analysis of STOCKS & COMMODITIES magazine, Working-Money.com, and Traders.com Advantage.
PRINT THIS ARTICLE
SYMMETRICAL TRIANGLE
The Symmetrical Triangle And The Regional Banks
01/31/05 08:09:59 AMby David Penn
A symmetrical triangle develops during the course of the downtrend in RKH. Is an upside breakout any more or less likely than a downside breakdown?
Position: N/A
| For some, there are only two questions you need to ask in order to figure out how well the stock market is doing: "How are the semiconductors?" is the first, and "How are the financials?" is the second. |
| In this piece, I want to look at the financials--particularly the regional banks. The regional banks topped out along with the rest of the market in late December. But these banks--represented by RKH, the exchange-traded HOLDRS--had actually been signaling weakness for some time. |

|
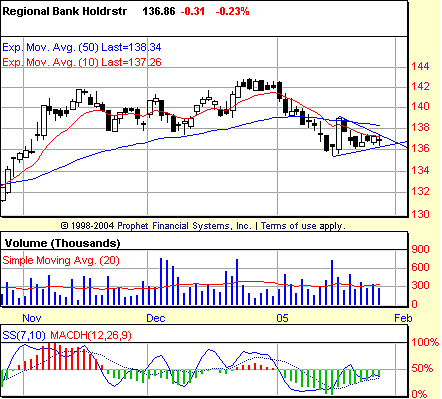
| Figure 1: After a series of negative stochastic divergences, RKH finally gives way in January. Any breakout to the upside from the symmetrical triangle that formed in the second half of January will face some measure of resistance from both the 10- and 50-day exponential moving averages. With a formation size of 3.4, a breakdown to the 133.25 level should be expected should RKH move lower. |
| Graphic provided by: Prophet Financial, Inc. |
| |
| This weakness was anticipated as early as November with a negative stochastic divergence that anticipated a down-to-sideways market going forward. From mid-November to mid-December, this down-to-sideways movement is exactly what characterized trading in RKH. Nevertheless, after this month-long excursion into bearishness, RKH went on to make a higher high in later in December. But even this higher high was dogged by another negative stochastic divergence. Given the way that RKH managed its last encounter with a negative stochastic divergence, the best that could be hoped for might have been another sideways market. The worst? A sharp, sudden decline. |
| The worst did indeed come to the regional banks as January saw the RKH plunge below a 50-day exponential moving average (EMA) that was beginning to roll over and down. As the selling continued, the 10-day EMA also dipped below the 50-day. Even a sharp rally day that saw the RKH soar nearly 3.5 points could not completely stem the bearishness. What that rally day did do was set the stage for the symmetrical triangle that is the dominant technical feature on the chart of RKH right now. Symmetrical triangles tend to be continuation patterns, which means that, given the location of this symmetrical triangle in the midst of a year-to-date downtrend in both RKH and the broader stock market, a trader could be forgiven for attempting to anticipate the break. |
| That said, the conventional wisdom on symmetrical triangles (on all triangles, really) is to wait for one of the support levels to be penetrated before taking a position in the direction of the anticipated break. Applying that wisdom to the symmetrical triangle in RKH would suggest that traders be patient, waiting for the regional banks to begin to show their hand, before "seeing" their "call." |
Technical Writer for Technical Analysis of STOCKS & COMMODITIES magazine, Working-Money.com, and Traders.com Advantage.
| Title: | Technical Writer |
| Company: | Technical Analysis, Inc. |
| Address: | 4757 California Avenue SW |
| Seattle, WA 98116 | |
| Phone # for sales: | 206 938 0570 |
| Fax: | 206 938 1307 |
| Website: | www.Traders.com |
| E-mail address: | DPenn@traders.com |
Traders' Resource Links | |
| Charting the Stock Market: The Wyckoff Method -- Books | |
| Working-Money.com -- Online Trading Services | |
| Traders.com Advantage -- Online Trading Services | |
| Technical Analysis of Stocks & Commodities -- Publications and Newsletters | |
| Working Money, at Working-Money.com -- Publications and Newsletters | |
| Traders.com Advantage -- Publications and Newsletters | |
| Professional Traders Starter Kit -- Software | |
Click here for more information about our publications!
Comments
Date: 02/05/05Rank: 3Comment:

|

Request Information From Our Sponsors
- StockCharts.com, Inc.
- Candle Patterns
- Candlestick Charting Explained
- Intermarket Technical Analysis
- John Murphy on Chart Analysis
- John Murphy's Chart Pattern Recognition
- John Murphy's Market Message
- MurphyExplainsMarketAnalysis-Intermarket Analysis
- MurphyExplainsMarketAnalysis-Visual Analysis
- StockCharts.com
- Technical Analysis of the Financial Markets
- The Visual Investor
- VectorVest, Inc.
- Executive Premier Workshop
- One-Day Options Course
- OptionsPro
- Retirement Income Workshop
- Sure-Fire Trading Systems (VectorVest, Inc.)
- Trading as a Business Workshop
- VectorVest 7 EOD
- VectorVest 7 RealTime/IntraDay
- VectorVest AutoTester
- VectorVest Educational Services
- VectorVest OnLine
- VectorVest Options Analyzer
- VectorVest ProGraphics v6.0
- VectorVest ProTrader 7
- VectorVest RealTime Derby Tool
- VectorVest Simulator
- VectorVest Variator
- VectorVest Watchdog
