HOT TOPICS LIST
- MACD
- Fibonacci
- RSI
- Gann
- ADXR
- Stochastics
- Volume
- Triangles
- Futures
- Cycles
- Volatility
- ZIGZAG
- MESA
- Retracement
- Aroon
INDICATORS LIST
LIST OF TOPICS
PRINT THIS ARTICLE
by David Penn
A negative stochastic divergence during the greenback's January advance suggests a pullback in the dollar's month-long rally.
Position: N/A
David Penn
Technical Writer for Technical Analysis of STOCKS & COMMODITIES magazine, Working-Money.com, and Traders.com Advantage.
PRINT THIS ARTICLE
REVERSAL
Does The Divergence Signal Dollar Weakness?
01/31/05 07:58:41 AMby David Penn
A negative stochastic divergence during the greenback's January advance suggests a pullback in the dollar's month-long rally.
Position: N/A
| As the longest-running dollar bull around, I was heartened to see the greenback finally show followthrough on the positive stochastic divergences that had anticipated a bounce for months (the last being the positive divergence that developed in the autumn of 2004, a development chronicled in my last dollar article for Traders.com Advantage, "The Dollar's Last Ditch Divergence," November 10, 2004). |
| So it turns out that divergence wasn't quite as "last ditch" as the headline might suggest. Nevertheless, the most recent positive stochastic divergence in December seems to have accurately (and finally) anticipated the bounce in the greenback. This divergence has even been confirmed by the greenback's ability to close above 82 on January 4--the 82 level being the high of the day that coincided with the earlier of the two stochastic troughs that produced the divergence. |

|
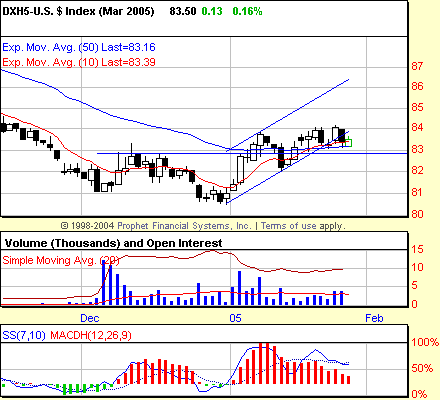
| Figure 1: Negative stochastic divergences often anticipate corrections. But those corrections do not always lead to sharply lower prices. So far, the negative stochastic divergence--which has yet to be confirmed--is yielding sideways action in the March greenback. |
| Graphic provided by: Prophet Financial, Inc. |
| |
| Moving into January, the dollar appears to have created another stochastic divergence for itself. This time, however, the divergence is a negative one--created by the successively higher peak in the greenback in early and late January, and the successively lower stochastic peaks occurring at the same time. The bearishness of this negative stochastic divergence has yet to be confirmed by price; either a print of 82.79 (using the moving average convergence/divergence histogram [MACDH]-based approach) or a move below 82.72 (using the "Confirming Divergences" approach) would suggest sufficient followthrough to the downside for traders to be concerned about additional losses in the greenback. |
| The trend channel from the late December lows also contributes to a bearish picture for the dollar in the near term. Although the greenback hasn't closed beneath its 10-day exponential moving average (EMA) yet, it has already begun to plow into the side of its trend channel, for all intents and purpose breaking down below the lower support boundary of the channel. This may or may not lead to sharply lower prices. But it does look likely to stem any bullish momentum in the immediate term. |
| If the March dollar breaks down here, the first likely level of potential support is at 82, where there is a pivot low from January 12. Failing that, the only sure level where the bulls would be inclined to put up a fight is at the truly make-or-break lows of late December--beneath which there may be no more for dollar bulls other than the bearish abyss. |
Technical Writer for Technical Analysis of STOCKS & COMMODITIES magazine, Working-Money.com, and Traders.com Advantage.
| Title: | Technical Writer |
| Company: | Technical Analysis, Inc. |
| Address: | 4757 California Avenue SW |
| Seattle, WA 98116 | |
| Phone # for sales: | 206 938 0570 |
| Fax: | 206 938 1307 |
| Website: | www.Traders.com |
| E-mail address: | DPenn@traders.com |
Traders' Resource Links | |
| Charting the Stock Market: The Wyckoff Method -- Books | |
| Working-Money.com -- Online Trading Services | |
| Traders.com Advantage -- Online Trading Services | |
| Technical Analysis of Stocks & Commodities -- Publications and Newsletters | |
| Working Money, at Working-Money.com -- Publications and Newsletters | |
| Traders.com Advantage -- Publications and Newsletters | |
| Professional Traders Starter Kit -- Software | |
Click here for more information about our publications!
Comments
Date: 02/01/05Rank: 3Comment:
Date: 02/02/05Rank: 4Comment:
Date: 02/05/05Rank: 3Comment:

Request Information From Our Sponsors
- StockCharts.com, Inc.
- Candle Patterns
- Candlestick Charting Explained
- Intermarket Technical Analysis
- John Murphy on Chart Analysis
- John Murphy's Chart Pattern Recognition
- John Murphy's Market Message
- MurphyExplainsMarketAnalysis-Intermarket Analysis
- MurphyExplainsMarketAnalysis-Visual Analysis
- StockCharts.com
- Technical Analysis of the Financial Markets
- The Visual Investor
- VectorVest, Inc.
- Executive Premier Workshop
- One-Day Options Course
- OptionsPro
- Retirement Income Workshop
- Sure-Fire Trading Systems (VectorVest, Inc.)
- Trading as a Business Workshop
- VectorVest 7 EOD
- VectorVest 7 RealTime/IntraDay
- VectorVest AutoTester
- VectorVest Educational Services
- VectorVest OnLine
- VectorVest Options Analyzer
- VectorVest ProGraphics v6.0
- VectorVest ProTrader 7
- VectorVest RealTime Derby Tool
- VectorVest Simulator
- VectorVest Variator
- VectorVest Watchdog
