HOT TOPICS LIST
- MACD
- Fibonacci
- RSI
- Gann
- ADXR
- Stochastics
- Volume
- Triangles
- Futures
- Cycles
- Volatility
- ZIGZAG
- MESA
- Retracement
- Aroon
INDICATORS LIST
LIST OF TOPICS
PRINT THIS ARTICLE
by Koos van der Merwe
Weekly gold has found its support and resistance levels. Can it help us predict the future?
Position: Sell
Koos van der Merwe
Has been a technical analyst since 1969, and has worked as a futures and options trader with First Financial Futures in Johannesburg, South Africa.
PRINT THIS ARTICLE
TREND-CHANNEL
London Gold
01/28/05 11:28:13 AMby Koos van der Merwe
Weekly gold has found its support and resistance levels. Can it help us predict the future?
Position: Sell
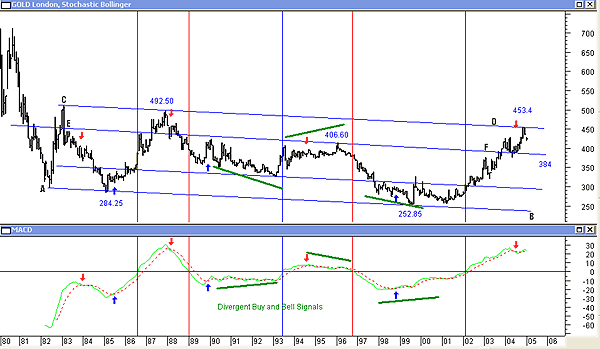
| Figure 1 shows the London gold price with support and resistance trendlines drawn in. I first drew the support line (AB), and then the resistance line (CD) parallel to AB. Then I drew the other internal trendlines parallel to AB from various pivot points as shown. It is interesting to note how often the gold price found these lines either for support or resistance. |
| The indicator is a standard moving average convergence/divergence (MACD). I have shown the trigger buy and sell signals with blue and red arrows, respectively. I have also drawn vertical lines as buy and sell confirmation signals as the MACD crossed the zero line. |

|
| Figure 1: This weekly chart of London gold suggests a possible future support and resistance level. |
| Graphic provided by: FutureSource.com. |
| |
| The result? The chart suggests that the gold price has found strong resistance at $453 and should now fall to test the support level at $384. This fall in the price is confirmed by the MACD indicator, which gave a sell signal as the price rose to resistance level. |
| The MACD indicator, as is customary, is a bit late or occasionally early with its signals, although there are two instances of a divergence signal, obvious on hindsight. No doubt about it: The trendline support and resistance levels are far more accurate in determining a turning point. |
| Gold should now trend toward the support trendline (EF) and with a possible bottom at the $384 level. The actual price for the turning point will depend on the time taken to fall to the trendline. |
Has been a technical analyst since 1969, and has worked as a futures and options trader with First Financial Futures in Johannesburg, South Africa.
| Address: | 3256 West 24th Ave |
| Vancouver, BC | |
| Phone # for sales: | 6042634214 |
| E-mail address: | petroosp@gmail.com |
Click here for more information about our publications!
Comments
Date: 02/05/05Rank: 3Comment:

Request Information From Our Sponsors
- VectorVest, Inc.
- Executive Premier Workshop
- One-Day Options Course
- OptionsPro
- Retirement Income Workshop
- Sure-Fire Trading Systems (VectorVest, Inc.)
- Trading as a Business Workshop
- VectorVest 7 EOD
- VectorVest 7 RealTime/IntraDay
- VectorVest AutoTester
- VectorVest Educational Services
- VectorVest OnLine
- VectorVest Options Analyzer
- VectorVest ProGraphics v6.0
- VectorVest ProTrader 7
- VectorVest RealTime Derby Tool
- VectorVest Simulator
- VectorVest Variator
- VectorVest Watchdog
- StockCharts.com, Inc.
- Candle Patterns
- Candlestick Charting Explained
- Intermarket Technical Analysis
- John Murphy on Chart Analysis
- John Murphy's Chart Pattern Recognition
- John Murphy's Market Message
- MurphyExplainsMarketAnalysis-Intermarket Analysis
- MurphyExplainsMarketAnalysis-Visual Analysis
- StockCharts.com
- Technical Analysis of the Financial Markets
- The Visual Investor
