HOT TOPICS LIST
- MACD
- Fibonacci
- RSI
- Gann
- ADXR
- Stochastics
- Volume
- Triangles
- Futures
- Cycles
- Volatility
- ZIGZAG
- MESA
- Retracement
- Aroon
INDICATORS LIST
LIST OF TOPICS
PRINT THIS ARTICLE
by Kevin Hopson
The US Dollar Index has rallied since late December, but this strength may be coming to an end.
Position: N/A
Kevin Hopson
Kevin has been a technical analyst for roughly 10 years now. Previously, Kevin owned his own business and acted as a registered investment advisor, specializing in energy. He was also a freelance oil analyst for Orient Trading Co., a commodity futures trading firm in Japan. Kevin is currently a freelance writer.
PRINT THIS ARTICLE
TECHNICAL ANALYSIS
Is The Rally In The US Dollar Index Over?
01/28/05 07:59:18 AMby Kevin Hopson
The US Dollar Index has rallied since late December, but this strength may be coming to an end.
Position: N/A
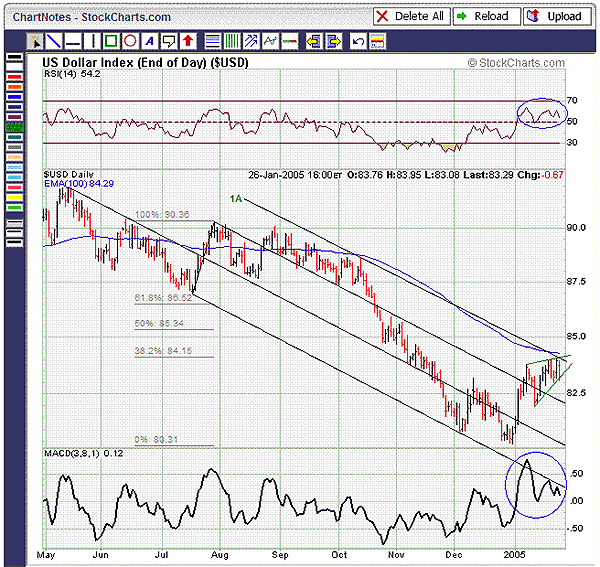
| Needless to say, the US Dollar Index (USD) has been in a strong downtrend for a while now. However, just like there are corrections during bull markets, there are rallies during bear markets. As you can see in the nine-month chart, the index has been in a bear rally since late December. Unfortunately for dollar longs, the current rally may be exhausted. |
| For one thing, note how the index has been moving higher this month in the form of a rising wedge, illustrated by the green trendlines. Rising wedges are normally bearish, meaning that prices tend to reverse to the downside. In the meantime, the relative strength index (RSI) and the moving average convergence/divergence (MACD) have both been putting in lower highs, as illustrated by the blue circles. These are bearish divergences. Coupled with the rising wedge formation, this action is indicative of a top. |

|
| Figure 1: US Dollar Index. As you can see in the nine-month chart, the index has been in a bear rally since late December. Unfortunately for dollar longs, the current rally may be exhausted. |
| Graphic provided by: StockCharts.com. |
| |
| Besides the bearish patterns we are seeing, the index also faces stiff resistance at slightly higher levels. More specifically, note how the 1A channel line, the index's 100-day moving average ($84.29) and the 38.2% retracement level ($84.15) from the July-December decline have all converged in the $84.00 to $84.30 range. This area of resistance has turned back prices thus far. Given the confluence of resistance here and the potentially bearish setup, I would be cautious on the US Dollar Index in the near term. |
Kevin has been a technical analyst for roughly 10 years now. Previously, Kevin owned his own business and acted as a registered investment advisor, specializing in energy. He was also a freelance oil analyst for Orient Trading Co., a commodity futures trading firm in Japan. Kevin is currently a freelance writer.
| Glen Allen, VA | |
| E-mail address: | hopson_1@yahoo.com |
Click here for more information about our publications!
Comments
Date: 02/05/05Rank: 4Comment:

Request Information From Our Sponsors
- StockCharts.com, Inc.
- Candle Patterns
- Candlestick Charting Explained
- Intermarket Technical Analysis
- John Murphy on Chart Analysis
- John Murphy's Chart Pattern Recognition
- John Murphy's Market Message
- MurphyExplainsMarketAnalysis-Intermarket Analysis
- MurphyExplainsMarketAnalysis-Visual Analysis
- StockCharts.com
- Technical Analysis of the Financial Markets
- The Visual Investor
- VectorVest, Inc.
- Executive Premier Workshop
- One-Day Options Course
- OptionsPro
- Retirement Income Workshop
- Sure-Fire Trading Systems (VectorVest, Inc.)
- Trading as a Business Workshop
- VectorVest 7 EOD
- VectorVest 7 RealTime/IntraDay
- VectorVest AutoTester
- VectorVest Educational Services
- VectorVest OnLine
- VectorVest Options Analyzer
- VectorVest ProGraphics v6.0
- VectorVest ProTrader 7
- VectorVest RealTime Derby Tool
- VectorVest Simulator
- VectorVest Variator
- VectorVest Watchdog
