HOT TOPICS LIST
- MACD
- Fibonacci
- RSI
- Gann
- ADXR
- Stochastics
- Volume
- Triangles
- Futures
- Cycles
- Volatility
- ZIGZAG
- MESA
- Retracement
- Aroon
INDICATORS LIST
LIST OF TOPICS
PRINT THIS ARTICLE
by David Penn
In a bull market since May 2004, REITs have been the real rally kings. So what can traders make of recent weakness in the group?
Position: N/A
David Penn
Technical Writer for Technical Analysis of STOCKS & COMMODITIES magazine, Working-Money.com, and Traders.com Advantage.
PRINT THIS ARTICLE
REVERSAL
The Rap On REITs
01/27/05 08:05:17 AMby David Penn
In a bull market since May 2004, REITs have been the real rally kings. So what can traders make of recent weakness in the group?
Position: N/A
| This is the kind of thing that drives some people crazy. I've been getting emails highlighting the outstanding performance of real estate investment trusts (REITs) for months--actually going back to late 2003. Because everything was going up in 2003, I didn't feel a need to underscore the performance of REITs. And in 2004, I was more preoccupied with those stocks that were struggling than I was with the REITs, which, after a vicious correction in April 2004, resumed their bullish ways over the balance of the year. |
| Now, here I am in January 2005, talking about REITs after they've shown almost as much weakness as they showed last spring. So if you want to blame me for not tipping you off to REITs a year or more ago, then you've got me dead to rights. I'll take the rap. But if you are wondering what you should be doing with REITs right now ... |

|
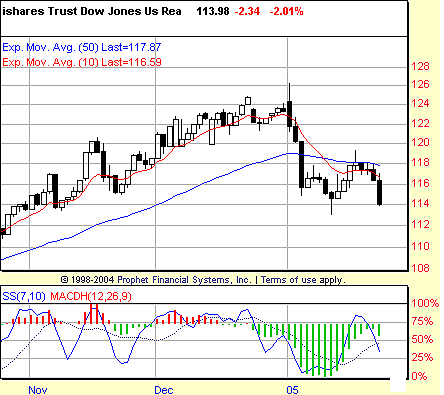
| Figure 1: $NLR. A short-term positive divergence in early January helped provide a badly needed bounce in $NLR. Will a longer-term positive stochastic divergence help create a real bottom? |
| Graphic provided by: Prophet Financial, Inc. |
| |
| For REITs, as the saying goes, there's good news and bad news. The good news is that after a precipitous drop early in January 2005, the Dow Jones US Real Estate Trust ishare (or $NLR) has developed a positive stochastic divergence. This divergence is between successively lower price troughs in early and mid-January accompanying successively higher stochastic troughs. All else being equal, this is the kind of positive stochastic divergence that often signals the end of a decline. In addition, trading on the day of the latter price trough took the form of a hammer--a bullish candlestick pattern common in Japanese candlestick charting. |
| The bad news is pretty bad. REITs broke down early in January and bounced midmonth, courtesy of a positive stochastic divergence. There was even a hammer on the second lower low in price (January 12) to "seal the deal." But the divergence bounce met serious resistance at the 50-day exponential moving average (EMA), signaling the seriousness of that resistance with a hanging man candlestick on January 19. At that point, $NLR reversed and, after a few sputtering steps, plunged back down toward the lows of the month. |
| The 50-day EMA is not always a sure resistance level. But when it proves itself to be capable of providing resistance, that event is worth noting. While it remains to see whether $NLR will close low enough to negate the relatively bullishness of that January 12th hammer (which still serves as a pivot low until exceeded), REIT shareholders are probably better off proceeding with caution until the index makes it back above the 50-day EMA. Failing that, the positive divergence scenario is the best hope going forward for REIT bulls. |
Technical Writer for Technical Analysis of STOCKS & COMMODITIES magazine, Working-Money.com, and Traders.com Advantage.
| Title: | Technical Writer |
| Company: | Technical Analysis, Inc. |
| Address: | 4757 California Avenue SW |
| Seattle, WA 98116 | |
| Phone # for sales: | 206 938 0570 |
| Fax: | 206 938 1307 |
| Website: | www.Traders.com |
| E-mail address: | DPenn@traders.com |
Traders' Resource Links | |
| Charting the Stock Market: The Wyckoff Method -- Books | |
| Working-Money.com -- Online Trading Services | |
| Traders.com Advantage -- Online Trading Services | |
| Technical Analysis of Stocks & Commodities -- Publications and Newsletters | |
| Working Money, at Working-Money.com -- Publications and Newsletters | |
| Traders.com Advantage -- Publications and Newsletters | |
| Professional Traders Starter Kit -- Software | |
Click here for more information about our publications!
Comments
Date: 02/01/05Rank: 3Comment:
Date: 02/05/05Rank: 4Comment:

Request Information From Our Sponsors
- VectorVest, Inc.
- Executive Premier Workshop
- One-Day Options Course
- OptionsPro
- Retirement Income Workshop
- Sure-Fire Trading Systems (VectorVest, Inc.)
- Trading as a Business Workshop
- VectorVest 7 EOD
- VectorVest 7 RealTime/IntraDay
- VectorVest AutoTester
- VectorVest Educational Services
- VectorVest OnLine
- VectorVest Options Analyzer
- VectorVest ProGraphics v6.0
- VectorVest ProTrader 7
- VectorVest RealTime Derby Tool
- VectorVest Simulator
- VectorVest Variator
- VectorVest Watchdog
- StockCharts.com, Inc.
- Candle Patterns
- Candlestick Charting Explained
- Intermarket Technical Analysis
- John Murphy on Chart Analysis
- John Murphy's Chart Pattern Recognition
- John Murphy's Market Message
- MurphyExplainsMarketAnalysis-Intermarket Analysis
- MurphyExplainsMarketAnalysis-Visual Analysis
- StockCharts.com
- Technical Analysis of the Financial Markets
- The Visual Investor
