HOT TOPICS LIST
- MACD
- Fibonacci
- RSI
- Gann
- ADXR
- Stochastics
- Volume
- Triangles
- Futures
- Cycles
- Volatility
- ZIGZAG
- MESA
- Retracement
- Aroon
INDICATORS LIST
LIST OF TOPICS
PRINT THIS ARTICLE
by David Penn
For all the concern over the January 2005 correction, the market is still just testing its November 2004 breakout.
Position: N/A
David Penn
Technical Writer for Technical Analysis of STOCKS & COMMODITIES magazine, Working-Money.com, and Traders.com Advantage.
PRINT THIS ARTICLE
BREAKOUTS
Testing The Breakout
01/27/05 09:18:11 AMby David Penn
For all the concern over the January 2005 correction, the market is still just testing its November 2004 breakout.
Position: N/A
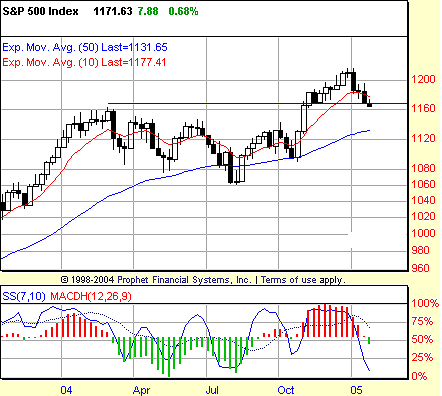
| In an article for Traders.com Advantage ("A Tale Of Two Channels," January 18, 2005), I argued that even if the Standard & Poor's 500 were to continue to fall as far as its 50-day exponential moving average (EMA), the intermediate-term (that is, multimonth) trend would still remain upward. This look at the S&P 500 takes a different look at the January 2005 correction, but reaches similar conclusions: at this point, there is nothing overwhelmingly bearish about the market right now. |
| One lens through which to view the January correction is as a test of the breakout from November 2004. This breakout came as the S&P 500 moved up above its 10-week EMA, a moving average that was--along with the market--making a new high. The breakout level is effectively between the low of the holiday-shortened week (January 17-21) of about 1168 and the March 2004 highs near 1164. And it is this level the S&P 500 has been probing in recent days as the market corrects. |

|
| Figure 1: S&P 500. This weekly chart of the S&P 500 reveals the January 2005 correction to be a pullback in the wake of the November 2004 breakout. |
| Graphic provided by: Prophet Financial, Inc. |
| |
| The confluence of these potential support levels--the low of the holiday-shortened week, the highs from the spring of 2004--argues strongly for, at a minimum, a bounce. This bounce appears to be taking place over the first half of trading on Tuesday, January 25. Nevertheless, even if the market moves lower, breaking down beneath these potential support levels, there is a good chance that it will find some support at the 50-day EMA. Bear markets are built with lower highs and lower lows. Bull markets are built with higher highs and higher lows. Those in the bearish camp have a sudden and surprising (to many) correction in their favor. But until the S&P 500 makes a lower high or a lower low on the weekly chart, the intermediate-term picture remains bullish--albeit bullish in the current context of a multiweek correction. That doesn't mean an investor shouldn't get defensive before that point happens, and it doesn't mean that a trader shouldn't take advantage of a correction in an intermediate-term advance by selling short. |
| But this understanding should help, to coin a phrase, curb enthusiasm (or panic). Bears need to be wary of the sort of sharp "bounce-turned-countertrend rally-turned breakout" that caught so many of them unawares back in the autumn of 2004. And bulls need to guard against the sort of fear that will have them selling just as the market is poised to turn back around. |
| The weekly stochastic shows the market to be deeply oversold, but looking at the bottom that was formed in August 2004, we should not be too desperate in looking for a positive stochastic divergence (on a weekly basis) to demarcate a bottom. Instead, bulls looking to get long (and bears looking to cover) might find the moving average convergence/divergence histogram (MACDH) to be worth watching. As long as the market remains above the 50-week EMA, then any higher low in the histogram will create a buying opportunity if there is price followthrough to the upside. |
Technical Writer for Technical Analysis of STOCKS & COMMODITIES magazine, Working-Money.com, and Traders.com Advantage.
| Title: | Technical Writer |
| Company: | Technical Analysis, Inc. |
| Address: | 4757 California Avenue SW |
| Seattle, WA 98116 | |
| Phone # for sales: | 206 938 0570 |
| Fax: | 206 938 1307 |
| Website: | www.Traders.com |
| E-mail address: | DPenn@traders.com |
Traders' Resource Links | |
| Charting the Stock Market: The Wyckoff Method -- Books | |
| Working-Money.com -- Online Trading Services | |
| Traders.com Advantage -- Online Trading Services | |
| Technical Analysis of Stocks & Commodities -- Publications and Newsletters | |
| Working Money, at Working-Money.com -- Publications and Newsletters | |
| Traders.com Advantage -- Publications and Newsletters | |
| Professional Traders Starter Kit -- Software | |
Click here for more information about our publications!
Comments
Date: 02/05/05Rank: 5Comment:

|

Request Information From Our Sponsors
- StockCharts.com, Inc.
- Candle Patterns
- Candlestick Charting Explained
- Intermarket Technical Analysis
- John Murphy on Chart Analysis
- John Murphy's Chart Pattern Recognition
- John Murphy's Market Message
- MurphyExplainsMarketAnalysis-Intermarket Analysis
- MurphyExplainsMarketAnalysis-Visual Analysis
- StockCharts.com
- Technical Analysis of the Financial Markets
- The Visual Investor
- VectorVest, Inc.
- Executive Premier Workshop
- One-Day Options Course
- OptionsPro
- Retirement Income Workshop
- Sure-Fire Trading Systems (VectorVest, Inc.)
- Trading as a Business Workshop
- VectorVest 7 EOD
- VectorVest 7 RealTime/IntraDay
- VectorVest AutoTester
- VectorVest Educational Services
- VectorVest OnLine
- VectorVest Options Analyzer
- VectorVest ProGraphics v6.0
- VectorVest ProTrader 7
- VectorVest RealTime Derby Tool
- VectorVest Simulator
- VectorVest Variator
- VectorVest Watchdog
