HOT TOPICS LIST
- MACD
- Fibonacci
- RSI
- Gann
- ADXR
- Stochastics
- Volume
- Triangles
- Futures
- Cycles
- Volatility
- ZIGZAG
- MESA
- Retracement
- Aroon
INDICATORS LIST
LIST OF TOPICS
PRINT THIS ARTICLE
by David Penn
A descending triangle at the top of Intel's late 2004 rally suggests a sharp reversal.
Position: N/A
David Penn
Technical Writer for Technical Analysis of STOCKS & COMMODITIES magazine, Working-Money.com, and Traders.com Advantage.
PRINT THIS ARTICLE
TRIANGLES
Intel Ugliness
01/27/05 07:45:38 AMby David Penn
A descending triangle at the top of Intel's late 2004 rally suggests a sharp reversal.
Position: N/A
| Full disclosure: I lost a couple of bucks trying to short Intel late last year. But it increasingly looks like those semiconductor bears that waited until the New Year--and the passage of a surprising autumn rally--to act upon their sentiments may prove to be well rewarded. |
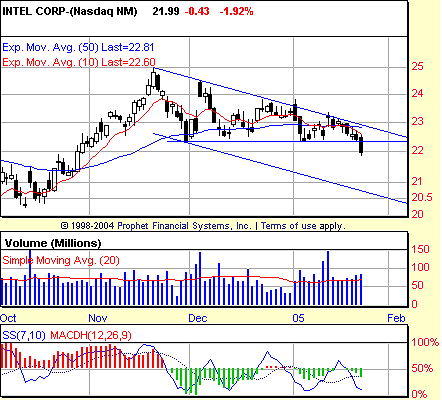
| There are two interesting technical developments in Intel over the past few months. The first is the bearish trend channel that begins with Intel's top in late November. Since that November peak, Intel has tested the top boundary of this channel for resistance no less than four times from November 2004 to January 2005. On none of those occasions was Intel successful. |

|
| Figure 1: A breakdown from this descending triangle could see the price of Intel shares plunging through the lower boundary of a multimonth trend channel. |
| Graphic provided by: Prophet Financial, Inc. |
| |
| Generally speaking, when a market repeatedly tests a level for resistance, there is a good chance that one of those tests will eventually produce a breakout. However, the fact that Intel repeated closing beneath a sideways-to-downwardly sloping 10-day exponential moving average (EMA) was a warning that the stock might not have the strength necessary to power up and out of the trend channel. No less ominous for Intel shareholders is the descending triangle that also began in November 2004. This triangle extends as high as 25 and has a support line at about 22.5. At the same time that Intel was testing the top of the trend channel, it was also testing the bottom of that descending triangle. And in this case the repeated test did provide the break, as shares of Intel broke down below horizontal support on Monday, January 24. |
| It is interesting how these two technical developments--the trend channel and the descending triangle--reinforced and played off of each other over the past few months. The trend channel initially set the upside limit for Intel as it moved down. Then the descending triangle helped provide a sense of when Intel's sub 10-day EMA movement had become especially precarious (that is, the breakdown from the triangle). Now it appears that both the trend channel and the descending triangle are working together to suggest the extent of the likely downside. The descending triangle--with a formation size of 2.5 and horizontal support at 22.5--projects a minimum downside of about 20. At the same time, the trend channel provides a sort of sliding scale on the downside. |
| There is a caveat to this bearish outlook. If the 7,10 stochastic fails to make a lower low in late January to correspond with the lower low in Intel's price in late January, then there is an excellent chance that a positive stochastic divergence will develop with the breakdown from the descending triangle. This wouldn't necessarily mean that a bottom was imminent; some "running" divergences come with prices that continue to drop significantly before a reversal takes place. But it would begin to suggest that the balance of risk is tilting against the bears, bears that already have been mauling Intel since mid-November. |
Technical Writer for Technical Analysis of STOCKS & COMMODITIES magazine, Working-Money.com, and Traders.com Advantage.
| Title: | Technical Writer |
| Company: | Technical Analysis, Inc. |
| Address: | 4757 California Avenue SW |
| Seattle, WA 98116 | |
| Phone # for sales: | 206 938 0570 |
| Fax: | 206 938 1307 |
| Website: | www.Traders.com |
| E-mail address: | DPenn@traders.com |
Traders' Resource Links | |
| Charting the Stock Market: The Wyckoff Method -- Books | |
| Working-Money.com -- Online Trading Services | |
| Traders.com Advantage -- Online Trading Services | |
| Technical Analysis of Stocks & Commodities -- Publications and Newsletters | |
| Working Money, at Working-Money.com -- Publications and Newsletters | |
| Traders.com Advantage -- Publications and Newsletters | |
| Professional Traders Starter Kit -- Software | |
Click here for more information about our publications!
Comments
Date: 02/04/05Rank: 3Comment:

|

Request Information From Our Sponsors
- StockCharts.com, Inc.
- Candle Patterns
- Candlestick Charting Explained
- Intermarket Technical Analysis
- John Murphy on Chart Analysis
- John Murphy's Chart Pattern Recognition
- John Murphy's Market Message
- MurphyExplainsMarketAnalysis-Intermarket Analysis
- MurphyExplainsMarketAnalysis-Visual Analysis
- StockCharts.com
- Technical Analysis of the Financial Markets
- The Visual Investor
- VectorVest, Inc.
- Executive Premier Workshop
- One-Day Options Course
- OptionsPro
- Retirement Income Workshop
- Sure-Fire Trading Systems (VectorVest, Inc.)
- Trading as a Business Workshop
- VectorVest 7 EOD
- VectorVest 7 RealTime/IntraDay
- VectorVest AutoTester
- VectorVest Educational Services
- VectorVest OnLine
- VectorVest Options Analyzer
- VectorVest ProGraphics v6.0
- VectorVest ProTrader 7
- VectorVest RealTime Derby Tool
- VectorVest Simulator
- VectorVest Variator
- VectorVest Watchdog
