HOT TOPICS LIST
- MACD
- Fibonacci
- RSI
- Gann
- ADXR
- Stochastics
- Volume
- Triangles
- Futures
- Cycles
- Volatility
- ZIGZAG
- MESA
- Retracement
- Aroon
INDICATORS LIST
LIST OF TOPICS
PRINT THIS ARTICLE
by Chris Manuell
The euro has endured a healthy correction since late December and appears poised to resume the uptrend.
Position: N/A
Chris Manuell
Chris Manuell spent 7 years as a futures sales/trader for a large investment bank and more recently as a technical analyst for an independent research company. He has a bachelor of economics and graduate diploma in applied finance & investment. Currently enrolled in the CMT program with the MTA.
PRINT THIS ARTICLE
TECHNICAL ANALYSIS
Euro Ripe For A Bounce
01/26/05 08:36:07 AMby Chris Manuell
The euro has endured a healthy correction since late December and appears poised to resume the uptrend.
Position: N/A
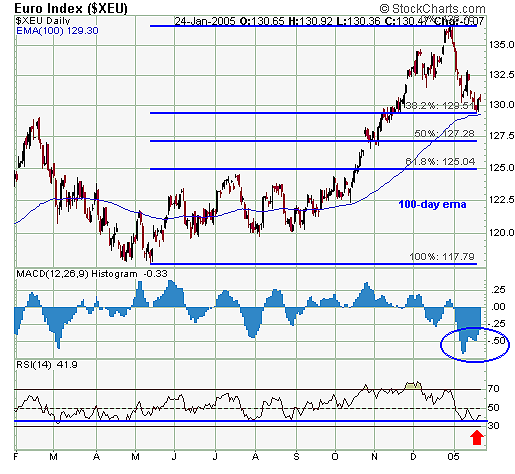
| The euro peaked on New Year's Eve, December 31, 2004, and has undergone a sharp correction following the strong eight-month rally. The market appears to be at that important juncture at which it decides to resume the primary trend. Last week, the euro touched the 0.382 Fibonacci level of the eight-month rally, which often marks a turning point for corrections. This level also remained in the vicinity of the 100-day exponential moving average (EMA), which also provided support in mid-October. |
| The relative strength index (RSI) is also attempting a bounce from the bullish support level of 40. The euro RSI found support in the 40 region on numerous occasions throughout 2004. The moving average convergence/divergence (MACD) histogram has also completed a double divergence, which sometimes is a precursor to a sharp bounce. |

|
| Figure 1: Daily Chart Euro Index |
| Graphic provided by: StockCharts.com. |
| |
Chris Manuell spent 7 years as a futures sales/trader for a large investment bank and more recently as a technical analyst for an independent research company. He has a bachelor of economics and graduate diploma in applied finance & investment. Currently enrolled in the CMT program with the MTA.
| E-mail address: | chrismanuell5@yahoo.co.uk |
Click here for more information about our publications!
Comments
Date: 02/04/05Rank: 3Comment:

Request Information From Our Sponsors
- StockCharts.com, Inc.
- Candle Patterns
- Candlestick Charting Explained
- Intermarket Technical Analysis
- John Murphy on Chart Analysis
- John Murphy's Chart Pattern Recognition
- John Murphy's Market Message
- MurphyExplainsMarketAnalysis-Intermarket Analysis
- MurphyExplainsMarketAnalysis-Visual Analysis
- StockCharts.com
- Technical Analysis of the Financial Markets
- The Visual Investor
- VectorVest, Inc.
- Executive Premier Workshop
- One-Day Options Course
- OptionsPro
- Retirement Income Workshop
- Sure-Fire Trading Systems (VectorVest, Inc.)
- Trading as a Business Workshop
- VectorVest 7 EOD
- VectorVest 7 RealTime/IntraDay
- VectorVest AutoTester
- VectorVest Educational Services
- VectorVest OnLine
- VectorVest Options Analyzer
- VectorVest ProGraphics v6.0
- VectorVest ProTrader 7
- VectorVest RealTime Derby Tool
- VectorVest Simulator
- VectorVest Variator
- VectorVest Watchdog
