HOT TOPICS LIST
- MACD
- Fibonacci
- RSI
- Gann
- ADXR
- Stochastics
- Volume
- Triangles
- Futures
- Cycles
- Volatility
- ZIGZAG
- MESA
- Retracement
- Aroon
INDICATORS LIST
LIST OF TOPICS
PRINT THIS ARTICLE
by Arthur Hill
Autozone has held up pretty well lately, but some bearish candlesticks and a gap may spell trouble ahead.
Position: Sell
Arthur Hill
Arthur Hill is currently editor of TDTrader.com, a website specializing in trading strategies, sector/industry specific breadth stats and overall technical analysis. He passed the Society of Technical Analysts (STA London) diploma exam with distinction is a Certified Financial Technician (CFTe). Prior to TD Trader, he was the Chief Technical Analyst for Stockcharts.com and the main contributor to the ChartSchool.
PRINT THIS ARTICLE
BOLLINGER BANDS
Mind The Gap For Autozone
01/26/05 08:27:22 AMby Arthur Hill
Autozone has held up pretty well lately, but some bearish candlesticks and a gap may spell trouble ahead.
Position: Sell
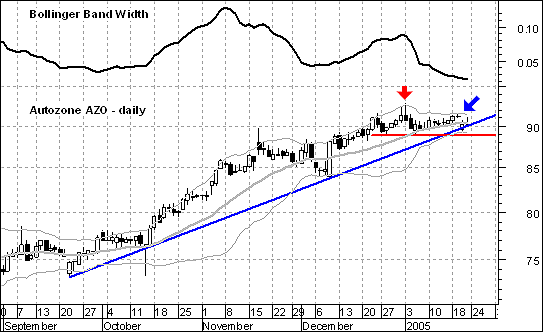
| Autozone (AZO) moved above 90 in mid-December and then started to consolidate. The Bollinger Bands have been overlaid and are trading relatively tight. The upper indicator shows the Bollinger Band width and is trading at its lowest level in almost five months. These volatility-based bands expand as the range of trading increases and contract as the range decreases. The theory is that tightening ranges signal a consolidation and often foreshadow a significant move. For a clue on direction, we can turn to the candlesticks and price chart (Figure 1). |
| The stock formed two shooting stars and cannot push above 93. The first one ended the year and the second began the year (red arrow). These candlesticks reflect intraday buying pressure that failed to hold. The bulls were able to push prices higher in the early going, but the bears ultimately regained and forced a weak close. Even though the stock fell below 90 on January 4, a trading range unfolded to keep prices firm and the shooting star on hold. |

|
| Figure 1: Autozone. The stock formed two shooting stars and cannot push above 93. The first one ended the year and the second began the year (red arrow). These candlesticks reflect intraday buying pressure that failed to hold. |
| Graphic provided by: MetaStock. |
| Graphic provided by: Reuters Data. |
| |
| More recently, the stock gapped down on January 20 (blue arrow) and found support right at the trendline extending up from the September lows. There is also support around 89 from the late December and early January lows. This support level is confirmed by the lower Bollinger Band and holds the key to the current uptrend. A move below 89 would break trading range support, break the September trendline, and signal a continuation of the January 20th gap down. This would be enough to take a bearish stand and expect further weakness. Should support at 89 hold, a move above 91.5 would fill the gap and signal a continuation higher. |
Arthur Hill is currently editor of TDTrader.com, a website specializing in trading strategies, sector/industry specific breadth stats and overall technical analysis. He passed the Society of Technical Analysts (STA London) diploma exam with distinction is a Certified Financial Technician (CFTe). Prior to TD Trader, he was the Chief Technical Analyst for Stockcharts.com and the main contributor to the ChartSchool.
| Title: | Editor |
| Company: | TDTrader.com |
| Address: | Willem Geetsstraat 17 |
| Mechelen, B2800 | |
| Phone # for sales: | 3215345465 |
| Website: | www.tdtrader.com |
| E-mail address: | arthurh@tdtrader.com |
Traders' Resource Links | |
| TDTrader.com has not added any product or service information to TRADERS' RESOURCE. | |
Click here for more information about our publications!
Comments
Date: 02/04/05Rank: 5Comment:

Request Information From Our Sponsors
- StockCharts.com, Inc.
- Candle Patterns
- Candlestick Charting Explained
- Intermarket Technical Analysis
- John Murphy on Chart Analysis
- John Murphy's Chart Pattern Recognition
- John Murphy's Market Message
- MurphyExplainsMarketAnalysis-Intermarket Analysis
- MurphyExplainsMarketAnalysis-Visual Analysis
- StockCharts.com
- Technical Analysis of the Financial Markets
- The Visual Investor
- VectorVest, Inc.
- Executive Premier Workshop
- One-Day Options Course
- OptionsPro
- Retirement Income Workshop
- Sure-Fire Trading Systems (VectorVest, Inc.)
- Trading as a Business Workshop
- VectorVest 7 EOD
- VectorVest 7 RealTime/IntraDay
- VectorVest AutoTester
- VectorVest Educational Services
- VectorVest OnLine
- VectorVest Options Analyzer
- VectorVest ProGraphics v6.0
- VectorVest ProTrader 7
- VectorVest RealTime Derby Tool
- VectorVest Simulator
- VectorVest Variator
- VectorVest Watchdog
