HOT TOPICS LIST
- MACD
- Fibonacci
- RSI
- Gann
- ADXR
- Stochastics
- Volume
- Triangles
- Futures
- Cycles
- Volatility
- ZIGZAG
- MESA
- Retracement
- Aroon
INDICATORS LIST
LIST OF TOPICS
PRINT THIS ARTICLE
by Arthur Hill
The August rally carried the Nasdaq to a new reaction high, but the A/D line was left holding the bag and formed a large negative divergence.
Position: Sell
Arthur Hill
Arthur Hill is currently editor of TDTrader.com, a website specializing in trading strategies, sector/industry specific breadth stats and overall technical analysis. He passed the Society of Technical Analysts (STA London) diploma exam with distinction is a Certified Financial Technician (CFTe). Prior to TD Trader, he was the Chief Technical Analyst for Stockcharts.com and the main contributor to the ChartSchool.
PRINT THIS ARTICLE
A/D LINE
Nasdaq A/D Line Lagging
01/25/05 11:01:21 AMby Arthur Hill
The August rally carried the Nasdaq to a new reaction high, but the A/D line was left holding the bag and formed a large negative divergence.
Position: Sell
| The A/D line is a classic breadth indicator. It is formed by first subtracting the number of declining issues from the number of advancing issues. In this case, all issues on the Nasdaq are used. A cumulative total is formed by adding the net result each day. If there are more advancing issues than declining issues, the line will rise. If there are more declining issues than advancing issues, the line will decline. |
| In theory, the A/D line is supposed to keep pace with the underlying index. A strong A/D line in a rising market shows broad participation and reinforces the advance. A lagging or falling A/D line shows diminished participation, and this can foreshadow a bearish reversal. The inverse applies to declines. |

|
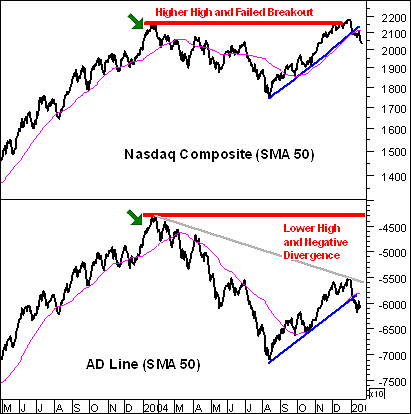
| Figure 1: The Nasdaq moved to a new reaction high at the end of 2004, but the A/D line remains well below its prior high. |
| Graphic provided by: MetaStock. |
| Graphic provided by: Reuters. |
| |
| Looking at the current A/D line, it is clear that a large negative divergence has formed over the last 13 months. The Nasdaq moved to a new reaction high at the end of 2004, but the A/D line remains well below its prior high. Even though the August advance was strong on price action, the A/D line suggests that the majority of Nasdaq stocks failed to keep pace. Note that the A/D line kept pace when the index reached a new high in January 2004 (green arrows). Both the Nasdaq and the A/D line recently broke below the trendlines extending up from the August lows, and this argues for further weakness. |
Arthur Hill is currently editor of TDTrader.com, a website specializing in trading strategies, sector/industry specific breadth stats and overall technical analysis. He passed the Society of Technical Analysts (STA London) diploma exam with distinction is a Certified Financial Technician (CFTe). Prior to TD Trader, he was the Chief Technical Analyst for Stockcharts.com and the main contributor to the ChartSchool.
| Title: | Editor |
| Company: | TDTrader.com |
| Address: | Willem Geetsstraat 17 |
| Mechelen, B2800 | |
| Phone # for sales: | 3215345465 |
| Website: | www.tdtrader.com |
| E-mail address: | arthurh@tdtrader.com |
Traders' Resource Links | |
| TDTrader.com has not added any product or service information to TRADERS' RESOURCE. | |
Click here for more information about our publications!
Comments
Date: 02/04/05Rank: 4Comment:

|

Request Information From Our Sponsors
- StockCharts.com, Inc.
- Candle Patterns
- Candlestick Charting Explained
- Intermarket Technical Analysis
- John Murphy on Chart Analysis
- John Murphy's Chart Pattern Recognition
- John Murphy's Market Message
- MurphyExplainsMarketAnalysis-Intermarket Analysis
- MurphyExplainsMarketAnalysis-Visual Analysis
- StockCharts.com
- Technical Analysis of the Financial Markets
- The Visual Investor
- VectorVest, Inc.
- Executive Premier Workshop
- One-Day Options Course
- OptionsPro
- Retirement Income Workshop
- Sure-Fire Trading Systems (VectorVest, Inc.)
- Trading as a Business Workshop
- VectorVest 7 EOD
- VectorVest 7 RealTime/IntraDay
- VectorVest AutoTester
- VectorVest Educational Services
- VectorVest OnLine
- VectorVest Options Analyzer
- VectorVest ProGraphics v6.0
- VectorVest ProTrader 7
- VectorVest RealTime Derby Tool
- VectorVest Simulator
- VectorVest Variator
- VectorVest Watchdog
