HOT TOPICS LIST
- MACD
- Fibonacci
- RSI
- Gann
- ADXR
- Stochastics
- Volume
- Triangles
- Futures
- Cycles
- Volatility
- ZIGZAG
- MESA
- Retracement
- Aroon
INDICATORS LIST
LIST OF TOPICS
PRINT THIS ARTICLE
by Kevin Hopson
The VIX and OEX are both approaching key price levels, which could dictate if the market sees a bounce in the near term or the January correction continues.
Position: N/A
Kevin Hopson
Kevin has been a technical analyst for roughly 10 years now. Previously, Kevin owned his own business and acted as a registered investment advisor, specializing in energy. He was also a freelance oil analyst for Orient Trading Co., a commodity futures trading firm in Japan. Kevin is currently a freelance writer.
PRINT THIS ARTICLE
VOLATILITY
What The VIX And S&P 100 Could Be Telling Us
01/24/05 09:08:46 AMby Kevin Hopson
The VIX and OEX are both approaching key price levels, which could dictate if the market sees a bounce in the near term or the January correction continues.
Position: N/A
| The CBOE Volatility Index (VIX) gauges market fear via option activity in the S&P 100 Index (OEX). More specifically, as investors become more pessimistic and pile their money into put options, volatility increases (and vice versa). Because volatility tends to be lowest near tops and highest near bottoms, the VIX is an excellent contrarian indicator. However, volatility levels alone do not signal tops and bottoms. Instead, it is what the VIX does at these levels that determines the final outcome. |
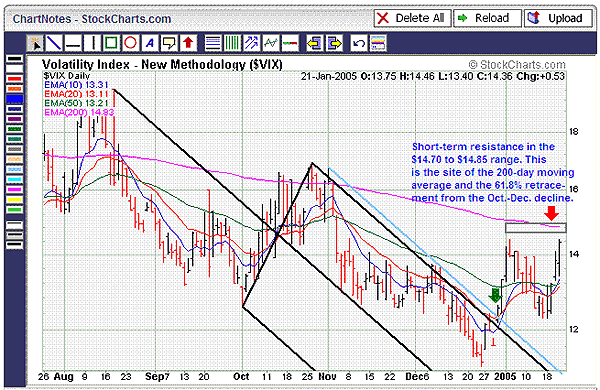
| If you look at the six-month chart for the VIX (Figure 1), you will see what I am talking about. For example, note how the VIX broke out of the falling pitchfork configuration in late December, which is illustrated by the green arrow. When prices breach the top parallel line of a pitchfork, as they did in early November, you always want to draw a sliding parallel line (or warning line) from the high. This is illustrated by the blue trendline. Note how prices tested this downtrend line in early December but failed to break out. When the VIX took out this trendline in late December and moved above its 10-day and 20-day moving averages in the process, it was a buy signal. It was a sign that volatility (fear) would likely increase in the near term. |

|
| Figure 1: Six-month VIX chart. The CBOE Volatility Index (VIX) gauges market fear via option activity in the S&P 100 Index (OEX). |
| Graphic provided by: StockCharts.com. |
| |
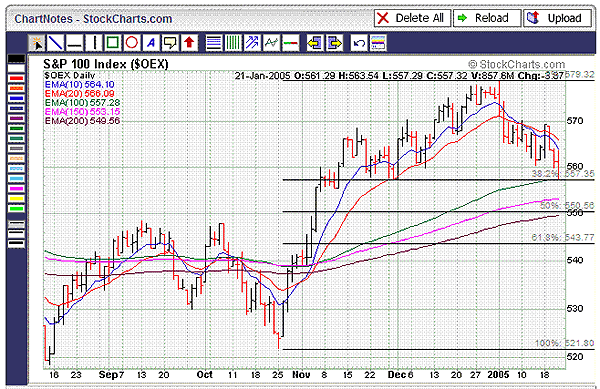
Because rising volatility normally leads to market weakness, it was an indication that a short-term top had likely been put in for the OEX. As you can see in the OEX chart (Figure 2), this was definitely the case. Just as the VIX broke higher, the OEX started to break down. This correction has continued to run its course over the past few weeks. However, with the VIX quickly approaching key resistance levels and the OEX currently testing support, the equity market could see a bounce in the near term. Figure 2: S&P 100. Because rising volatility normally leads to market weakness, it was an indication that a short-term top had likely been put in for the OEX. As you can see here, this was definitely the case. |
| If you turn your attention to the VIX chart, you will see that the $14.70 to $14.85 range is standing in the way of the current rally. This is the site of the 61.8% retracement level ($14.70) from the October to December decline, as well as the falling 200-day moving average ($14.83). On the flip side, the OEX is testing support around the 557 level. This is the site of the index's 100-day moving average (557.28) and the 38.2% retracement from the October to January rally (557.35). |
| Even if this price level fails to hold, there is a significant confluence of support in the 549 to 553 range. This is the site of the index's 150-day (553.15) and 200-day (549.56) moving averages, as well as the 50% retracement from the October to January rally. As a result, if the OEX closes below its 200-day moving average and the VIX closes above its 200-day moving average, it will likely point to further weakness in the market. However, if the OEX and VIX both fail to breach their 200-day moving averages, look for a short-term bottom in the market. |
Kevin has been a technical analyst for roughly 10 years now. Previously, Kevin owned his own business and acted as a registered investment advisor, specializing in energy. He was also a freelance oil analyst for Orient Trading Co., a commodity futures trading firm in Japan. Kevin is currently a freelance writer.
| Glen Allen, VA | |
| E-mail address: | hopson_1@yahoo.com |
Click here for more information about our publications!
Comments
Date: 01/24/05Rank: 5Comment:
Date: 02/04/05Rank: 3Comment:

Request Information From Our Sponsors
- StockCharts.com, Inc.
- Candle Patterns
- Candlestick Charting Explained
- Intermarket Technical Analysis
- John Murphy on Chart Analysis
- John Murphy's Chart Pattern Recognition
- John Murphy's Market Message
- MurphyExplainsMarketAnalysis-Intermarket Analysis
- MurphyExplainsMarketAnalysis-Visual Analysis
- StockCharts.com
- Technical Analysis of the Financial Markets
- The Visual Investor
- VectorVest, Inc.
- Executive Premier Workshop
- One-Day Options Course
- OptionsPro
- Retirement Income Workshop
- Sure-Fire Trading Systems (VectorVest, Inc.)
- Trading as a Business Workshop
- VectorVest 7 EOD
- VectorVest 7 RealTime/IntraDay
- VectorVest AutoTester
- VectorVest Educational Services
- VectorVest OnLine
- VectorVest Options Analyzer
- VectorVest ProGraphics v6.0
- VectorVest ProTrader 7
- VectorVest RealTime Derby Tool
- VectorVest Simulator
- VectorVest Variator
- VectorVest Watchdog
