

HOT TOPICS LIST
- MACD
- Fibonacci
- RSI
- Gann
- ADXR
- Stochastics
- Volume
- Triangles
- Futures
- Cycles
- Volatility
- ZIGZAG
- MESA
- Retracement
- Aroon
INDICATORS LIST
LIST OF TOPICS
PRINT THIS ARTICLE
by Arthur Hill
Cisco is pulling the Nasdaq down and remains an underperformer that may be about to make a significant move.
Position: Hold
Arthur Hill
Arthur Hill is currently editor of TDTrader.com, a website specializing in trading strategies, sector/industry specific breadth stats and overall technical analysis. He passed the Society of Technical Analysts (STA London) diploma exam with distinction is a Certified Financial Technician (CFTe). Prior to TD Trader, he was the Chief Technical Analyst for Stockcharts.com and the main contributor to the ChartSchool.
PRINT THIS ARTICLE
TRIANGLES
Cisco Is Pulling The Nasdaq Down
01/21/05 09:05:39 AMby Arthur Hill
Cisco is pulling the Nasdaq down and remains an underperformer that may be about to make a significant move.
Position: Hold
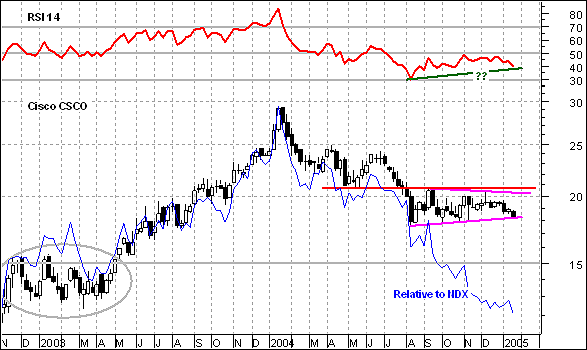
| While the Nasdaq, Standard & Poor's 500, and other indexes experienced big rallies from mid-August to late December, Cisco (CSCO) failed to catch a ride and remained range-bound the entire time. As the price relative confirms, the index has underperformed the Nasdaq 100 for all of 2004. The CSCO/NDX ratio or price relative (Figure 1, blue line) moved to a new lows from mid-August until early January. |
| On the price chart, the stock declined sharply in July and then formed a consolidation over the last six months. Note that broken support turned into resistance just below 21 (red line) and the stock never managed to recover from this support break. |
|
| Figure 1: CISCO. While the Nasdaq, Standard & Poor's 500, and other indexes experienced big rallies from mid-August to late December, Cisco (CSCO) failed to catch a ride and remained range-bound the entire time. As the price relative confirms, the index has underperformed the Nasdaq 100 for all of 2004. The CSCO/NDX ratio or price relative (blue line) moved to a new lows from mid-August until early January. |
| Graphic provided by: MetaStock. |
| Graphic provided by: Reuters Data. |
| |
| The pattern over the last six months looks like a triangle. The highs are progressively lower and the lows are progressively higher. As the triangle lines converge, the stock is being wound tighter and tighter-- like a coil ready to pop. The direction of the next break will dictate the next significant move. A break below the lower trendline would signal a continuation lower and project further weakness to around 15. This support area is confirmed by the consolidation that formed from November 2002 to April 2003 (gray oval). |
| For signs of strength, turn to the upper trendline and resistance from broken support. Should CSCO somehow hold above its prior lows and break to a new reaction high, the bulls would be back in the driver's seat. For additional confirmation, traders may also turn to the relative strength index (RSI). Note that the indicator has been below 50 since July. A positive divergence (green line) is working over the last several months, but it would take a move above 50 to turn momentum bullish again. |
Arthur Hill is currently editor of TDTrader.com, a website specializing in trading strategies, sector/industry specific breadth stats and overall technical analysis. He passed the Society of Technical Analysts (STA London) diploma exam with distinction is a Certified Financial Technician (CFTe). Prior to TD Trader, he was the Chief Technical Analyst for Stockcharts.com and the main contributor to the ChartSchool.
| Title: | Editor |
| Company: | TDTrader.com |
| Address: | Willem Geetsstraat 17 |
| Mechelen, B2800 | |
| Phone # for sales: | 3215345465 |
| Website: | www.tdtrader.com |
| E-mail address: | arthurh@tdtrader.com |
Traders' Resource Links | |
| TDTrader.com has not added any product or service information to TRADERS' RESOURCE. | |
Click here for more information about our publications!
Comments
Date:�01/21/05Rank:�5Comment:�
Date:�02/04/05Rank:�4Comment:�

Request Information From Our Sponsors
- StockCharts.com, Inc.
- Candle Patterns
- Candlestick Charting Explained
- Intermarket Technical Analysis
- John Murphy on Chart Analysis
- John Murphy's Chart Pattern Recognition
- John Murphy's Market Message
- MurphyExplainsMarketAnalysis-Intermarket Analysis
- MurphyExplainsMarketAnalysis-Visual Analysis
- StockCharts.com
- Technical Analysis of the Financial Markets
- The Visual Investor
- VectorVest, Inc.
- Executive Premier Workshop
- One-Day Options Course
- OptionsPro
- Retirement Income Workshop
- Sure-Fire Trading Systems (VectorVest, Inc.)
- Trading as a Business Workshop
- VectorVest 7 EOD
- VectorVest 7 RealTime/IntraDay
- VectorVest AutoTester
- VectorVest Educational Services
- VectorVest OnLine
- VectorVest Options Analyzer
- VectorVest ProGraphics v6.0
- VectorVest ProTrader 7
- VectorVest RealTime Derby Tool
- VectorVest Simulator
- VectorVest Variator
- VectorVest Watchdog