HOT TOPICS LIST
- MACD
- Fibonacci
- RSI
- Gann
- ADXR
- Stochastics
- Volume
- Triangles
- Futures
- Cycles
- Volatility
- ZIGZAG
- MESA
- Retracement
- Aroon
INDICATORS LIST
LIST OF TOPICS
PRINT THIS ARTICLE
by Kevin Hopson
A bullish triangle breakout and a pullback to key short-term support levels is creating an attractive opportunity.
Position: N/A
Kevin Hopson
Kevin has been a technical analyst for roughly 10 years now. Previously, Kevin owned his own business and acted as a registered investment advisor, specializing in energy. He was also a freelance oil analyst for Orient Trading Co., a commodity futures trading firm in Japan. Kevin is currently a freelance writer.
PRINT THIS ARTICLE
TRIANGLES
UEX Corp.'s Triangle Breakout
01/20/05 08:36:43 AMby Kevin Hopson
A bullish triangle breakout and a pullback to key short-term support levels is creating an attractive opportunity.
Position: N/A
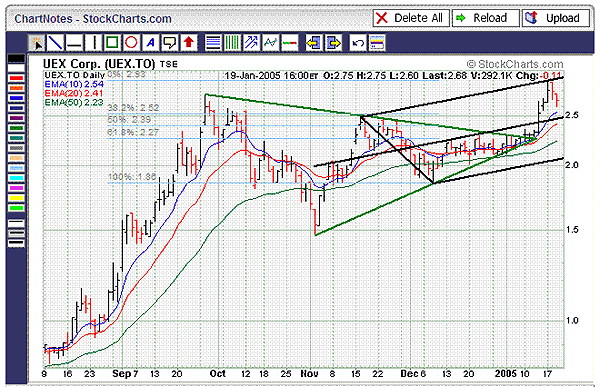
| UEX Corp. (UEX.TO) is a Canadian uranium exploration company that trades on the Toronto Stock Exchange, as well as the pink sheets (UEXCF.PK) in the United States. Technically speaking, UEX had been consolidating in a symmetrical triangle pattern since October 2004, as illustrated by the green trendlines. Because symmetrical triangles tend to be continuation patterns and the prior move was up, a breakout was expected. As you can see, the stock recently broke to the upside from this formation, thus confirming the triangle theory. |
| If you take the base of the triangle (high point - low point) and add this figure ($2.75-$1.50=$1.25) to the point of breakout ($2.25), you come up with a possible price target of $3.50. Based on the most recent closing price, this would represent a 30% increase in UEX shares. |

|
| Figure 1: UEX Corp. Technically, UEX had been consolidating in a symmetrical triangle pattern since October 2004, as illustrated by the green trendlines. Because symmetrical triangles tend to be continuation patterns and the prior move was up, a breakout was expected. As you can see, the stock recently broke to the upside from this formation, thus confirming the triangle theory. |
| Graphic provided by: StockCharts.com. |
| |
| In the meantime, the stock is pulling back to a key short-term support area in the $2.50 to $2.55 range. More specifically, note how the black median line, the stock's rising 10-day moving average ($2.54), and the 38.2% retracement level ($2.52) from the December-January rally have all converged in this price range. Given the confluence of support here, the $2.50 to $2.55 range could act as a good bouncing point for the stock and lead to a resumption of the rally. |
Kevin has been a technical analyst for roughly 10 years now. Previously, Kevin owned his own business and acted as a registered investment advisor, specializing in energy. He was also a freelance oil analyst for Orient Trading Co., a commodity futures trading firm in Japan. Kevin is currently a freelance writer.
| Glen Allen, VA | |
| E-mail address: | hopson_1@yahoo.com |
Click here for more information about our publications!
Comments
Date: 01/20/05Rank: 3Comment:
Date: 02/04/05Rank: 4Comment:

|

Request Information From Our Sponsors
- StockCharts.com, Inc.
- Candle Patterns
- Candlestick Charting Explained
- Intermarket Technical Analysis
- John Murphy on Chart Analysis
- John Murphy's Chart Pattern Recognition
- John Murphy's Market Message
- MurphyExplainsMarketAnalysis-Intermarket Analysis
- MurphyExplainsMarketAnalysis-Visual Analysis
- StockCharts.com
- Technical Analysis of the Financial Markets
- The Visual Investor
- VectorVest, Inc.
- Executive Premier Workshop
- One-Day Options Course
- OptionsPro
- Retirement Income Workshop
- Sure-Fire Trading Systems (VectorVest, Inc.)
- Trading as a Business Workshop
- VectorVest 7 EOD
- VectorVest 7 RealTime/IntraDay
- VectorVest AutoTester
- VectorVest Educational Services
- VectorVest OnLine
- VectorVest Options Analyzer
- VectorVest ProGraphics v6.0
- VectorVest ProTrader 7
- VectorVest RealTime Derby Tool
- VectorVest Simulator
- VectorVest Variator
- VectorVest Watchdog
