

HOT TOPICS LIST
- MACD
- Fibonacci
- RSI
- Gann
- ADXR
- Stochastics
- Volume
- Triangles
- Futures
- Cycles
- Volatility
- ZIGZAG
- MESA
- Retracement
- Aroon
INDICATORS LIST
LIST OF TOPICS
PRINT THIS ARTICLE
by David Penn
A diamond pattern forming in the wake of silver's sharp December correction threatens to send prices even lower.
Position: N/A
David Penn
Technical Writer for Technical Analysis of STOCKS & COMMODITIES magazine, Working-Money.com, and Traders.com Advantage.
PRINT THIS ARTICLE
THE DIAMOND
Shine On Silver Diamond?
01/19/05 11:55:04 AMby David Penn
A diamond pattern forming in the wake of silver's sharp December correction threatens to send prices even lower.
Position: N/A
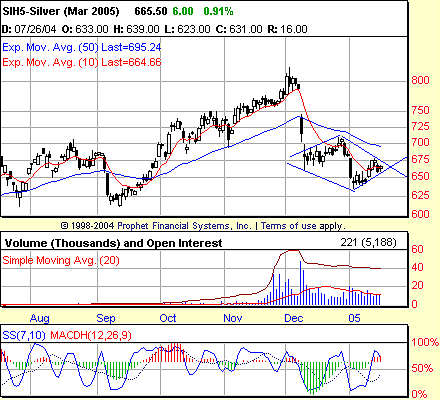
| There's no fading the impact of the sharp, early December correction in silver futures. Although weakness was telegraphed somewhat by the negative stochastic divergence that developed between the early November and early January peaks, the selloff was likely quite sudden for most. |
| The way I look at divergences in markets, March silver showed its vulnerability to the downside on December 7 when it hit 787.50 following a stochastic "divergence alert" the previous day. As Figure 1 shows, a short trade on December 7 would have been a very fortuitous trade indeed. March silver closed at 714.50 on December 8. |
|
| Figure 1: A negative stochastic divergence between the early November peak and the early December peak in March silver anticipated a massive drop in silver prices. |
| Graphic provided by: Prophet Financial, Inc. |
| |
| Since that epic collapse, March silver has consolidated in a sideways, diamond-shaped pattern. As we learn from Thomas Bulkowski (the author of ENCYCLOPEDIA OF CHART PATTERNS and a STOCKS & COMMODITIES Contributing Writer)--and a number of others who have written about diamond patterns--there is no obvious way to determine the direction of a breakout from such formations. There can be clues--such as the duration of the trend that preceded the diamond pattern. But short of factors like that, it can be difficult to determine whether a given diamond consolidation is "bullish" or "bearish." This is one of the reasons why traders are encouraged to wait until one of the right-side trendlines that bound the diamond pattern is penetrated before initiating a trade. |
| In the case of the diamond pattern in March silver, it is hard to avoid thinking that the correction that began in early December has already run its course by mid-January. If that were the case, if in fact the diamond pattern represented a diamond "bottom" instead of a diamond "continuation," then one of the things I would expect (or, at a minimum, hope for) would be a positive stochastic divergence between the December lows and the early January lows. The fact that there is no such divergence (I've checked both my Prophet.net chart--shown here--as well as my eSignal chart) suggests strongly to me that the correction has not run its course, and that more downside is likely. |
| While it is certainly possible for a market to form a bottom without a positive stochastic divergence, I still believe that--on a day-to-day basis--major bottoms tend to form positive stochastic divergences. In fact, one of the ways I evaluate a technique or indicator is by seeing how well a given technique or indicator would have done in certain key situations, such as the Crash of 1987, the market top in 2000 or, even more recently, the "Bush Bounce" bottom in October 2004. I appreciate win rates over time as much as the next technician. But a technique or indicator that leaves me on the sidelines during major moves is a technique or indicator that I, for one, never want to see ever again. The diamond in March silver is approximately 74 cents ($7.09 - $6.35), measured from the top of the formation to its lowest point. Subtracting this amount from the value at the likely breakout point of about $6.60 points to a minimum downside target of $5.86. Such follow-through to the downside would likely mean a test of multimonth lows--particularly the June 2004 lows just north of $5.70. |
Technical Writer for Technical Analysis of STOCKS & COMMODITIES magazine, Working-Money.com, and Traders.com Advantage.
| Title: | Technical Writer |
| Company: | Technical Analysis, Inc. |
| Address: | 4757 California Avenue SW |
| Seattle, WA 98116 | |
| Phone # for sales: | 206 938 0570 |
| Fax: | 206 938 1307 |
| Website: | www.Traders.com |
| E-mail address: | DPenn@traders.com |
Traders' Resource Links | |
| Charting the Stock Market: The Wyckoff Method -- Books | |
| Working-Money.com -- Online Trading Services | |
| Traders.com Advantage -- Online Trading Services | |
| Technical Analysis of Stocks & Commodities -- Publications and Newsletters | |
| Working Money, at Working-Money.com -- Publications and Newsletters | |
| Traders.com Advantage -- Publications and Newsletters | |
| Professional Traders Starter Kit -- Software | |
Click here for more information about our publications!
Comments
Date:�01/19/05Rank:�3Comment:�
Date:�02/03/05Rank:�3Comment:�

Request Information From Our Sponsors
- VectorVest, Inc.
- Executive Premier Workshop
- One-Day Options Course
- OptionsPro
- Retirement Income Workshop
- Sure-Fire Trading Systems (VectorVest, Inc.)
- Trading as a Business Workshop
- VectorVest 7 EOD
- VectorVest 7 RealTime/IntraDay
- VectorVest AutoTester
- VectorVest Educational Services
- VectorVest OnLine
- VectorVest Options Analyzer
- VectorVest ProGraphics v6.0
- VectorVest ProTrader 7
- VectorVest RealTime Derby Tool
- VectorVest Simulator
- VectorVest Variator
- VectorVest Watchdog
- StockCharts.com, Inc.
- Candle Patterns
- Candlestick Charting Explained
- Intermarket Technical Analysis
- John Murphy on Chart Analysis
- John Murphy's Chart Pattern Recognition
- John Murphy's Market Message
- MurphyExplainsMarketAnalysis-Intermarket Analysis
- MurphyExplainsMarketAnalysis-Visual Analysis
- StockCharts.com
- Technical Analysis of the Financial Markets
- The Visual Investor