HOT TOPICS LIST
- MACD
- Fibonacci
- RSI
- Gann
- ADXR
- Stochastics
- Volume
- Triangles
- Futures
- Cycles
- Volatility
- ZIGZAG
- MESA
- Retracement
- Aroon
INDICATORS LIST
LIST OF TOPICS
PRINT THIS ARTICLE
by David Penn
Are hogs headed higher? This cup with handle patterns seems to suggest so.
Position: N/A
David Penn
Technical Writer for Technical Analysis of STOCKS & COMMODITIES magazine, Working-Money.com, and Traders.com Advantage.
PRINT THIS ARTICLE
CUP WITH HANDLE
A Cup With Handle In Hogs
01/19/05 08:13:59 AMby David Penn
Are hogs headed higher? This cup with handle patterns seems to suggest so.
Position: N/A
| In the canon of exalted technical chart patterns--that hall of fame that includes directional triangles, head and shoulders patterns, and island reversals--surely the cup with handle pattern belongs. Not only is the cup with handle pattern one of the more observed patterns (legendary trader and author William O'Neil did as much as anyone to popularize this pattern in his book, HOW TO MAKE MONEY IN STOCKS), but also the cup with handle pattern is among the more observable and easy-to-spot of technical chart patterns. |
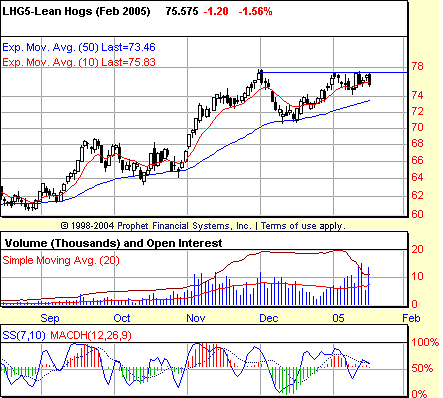
| The cup with handle that appears to have formed in lean hog futures (basis February), as seen in Figure 1, is one of those examples of the observability (!) of the pattern. It figuratively leapt off the computer monitor after I paged through chart after chart of chaotic, Kandinsky-like price charts in many of the futures. In tell-tale fashion, the cup with handle pattern in lean hogs begins with a November advance leading into the first corrective period (which represents the "cup" of the formation) lasting from late November 2004 to late December. |

|
| Figure 1: Breaking out of a largely sideways correction in November, lean hog futures rallied into what appears to be a bullish cup with handle pattern in December and January. |
| Graphic provided by: Prophet Financial, Inc. |
| |
| The handle for this cup with handle pattern developed over the last few days of December and into the first half of January. It is represented by a shallower scalloped correction. Note how, by comparison, the "cup" part of the cup with handle formation takes lean hog futures--which were extended going into November--down to the 50-day exponential moving average (EMA) where that part of the formation found support. During the formation of the smaller, shallower "handle," lean hog futures corrected only as far as the 10-day EMA. |
| What sort of upside does this cup with handle pattern project? Given a formation top just shy of 78 cents and a value at its lowest point of about 71 cents, traders can add the formation size of seven cents to the value at the top of the pattern to get a minimum upside of 85 cents. |
| What sort of danger signs might traders look for between now and such a bullish breakout? Given the move to the downside on Tuesday, January 18, seeing February hogs close back above the 10-day exponential moving average would be an initial promising sign. Failing that, a retreat to the 50-day EMA would be somewhat disconcerting to the bullish case at present, but it would not invalidate that case. Arguably, the cup with handle could be turned into an ascending triangle if what are the current "handle" lows just above 74 are taken out in a retreat to support at the 50-day EMA. |
Technical Writer for Technical Analysis of STOCKS & COMMODITIES magazine, Working-Money.com, and Traders.com Advantage.
| Title: | Technical Writer |
| Company: | Technical Analysis, Inc. |
| Address: | 4757 California Avenue SW |
| Seattle, WA 98116 | |
| Phone # for sales: | 206 938 0570 |
| Fax: | 206 938 1307 |
| Website: | www.Traders.com |
| E-mail address: | DPenn@traders.com |
Traders' Resource Links | |
| Charting the Stock Market: The Wyckoff Method -- Books | |
| Working-Money.com -- Online Trading Services | |
| Traders.com Advantage -- Online Trading Services | |
| Technical Analysis of Stocks & Commodities -- Publications and Newsletters | |
| Working Money, at Working-Money.com -- Publications and Newsletters | |
| Traders.com Advantage -- Publications and Newsletters | |
| Professional Traders Starter Kit -- Software | |
Click here for more information about our publications!
Comments
Date: 01/19/05Rank: 3Comment:
Date: 02/03/05Rank: 3Comment:

Request Information From Our Sponsors
- VectorVest, Inc.
- Executive Premier Workshop
- One-Day Options Course
- OptionsPro
- Retirement Income Workshop
- Sure-Fire Trading Systems (VectorVest, Inc.)
- Trading as a Business Workshop
- VectorVest 7 EOD
- VectorVest 7 RealTime/IntraDay
- VectorVest AutoTester
- VectorVest Educational Services
- VectorVest OnLine
- VectorVest Options Analyzer
- VectorVest ProGraphics v6.0
- VectorVest ProTrader 7
- VectorVest RealTime Derby Tool
- VectorVest Simulator
- VectorVest Variator
- VectorVest Watchdog
- StockCharts.com, Inc.
- Candle Patterns
- Candlestick Charting Explained
- Intermarket Technical Analysis
- John Murphy on Chart Analysis
- John Murphy's Chart Pattern Recognition
- John Murphy's Market Message
- MurphyExplainsMarketAnalysis-Intermarket Analysis
- MurphyExplainsMarketAnalysis-Visual Analysis
- StockCharts.com
- Technical Analysis of the Financial Markets
- The Visual Investor
