HOT TOPICS LIST
- MACD
- Fibonacci
- RSI
- Gann
- ADXR
- Stochastics
- Volume
- Triangles
- Futures
- Cycles
- Volatility
- ZIGZAG
- MESA
- Retracement
- Aroon
INDICATORS LIST
LIST OF TOPICS
PRINT THIS ARTICLE
by David Penn
What's this? "2004 rally dead in the water"?! Somebody forgot to tell the trend channels.
Position: N/A
David Penn
Technical Writer for Technical Analysis of STOCKS & COMMODITIES magazine, Working-Money.com, and Traders.com Advantage.
PRINT THIS ARTICLE
TREND-CHANNEL
A Tale Of Two Channels
01/18/05 03:58:42 PMby David Penn
What's this? "2004 rally dead in the water"?! Somebody forgot to tell the trend channels.
Position: N/A
| It's hard not to be little tickled when you read the introduction to Jon D. Markman's latest column for RealMoney.com: "Virtually every major technical analysis shop and market timer in the country has declared the 2004 rally dead in the water over the past two weeks. But Florida-based 'Lowry's Reports' is one exception. The firm has a great long-term record, so it's worth hearing its point of view." I don't know about the "virtually every major technical analysis shop" part. And maybe Traders.com is considered neither "major" nor a technical analysis "shop." If Markman had been looking for less bearish technical commentary over the past few weeks, then he could have easily considered Arthur Hill's Traders.com Advantage article "A Breakout, And Now A Test For The Dow Diamonds" from January 6, or even earlier, Gary Grosschadl's Traders Advantage article, "Anticipating A Short-Term Correction" from December 28, 2004. |
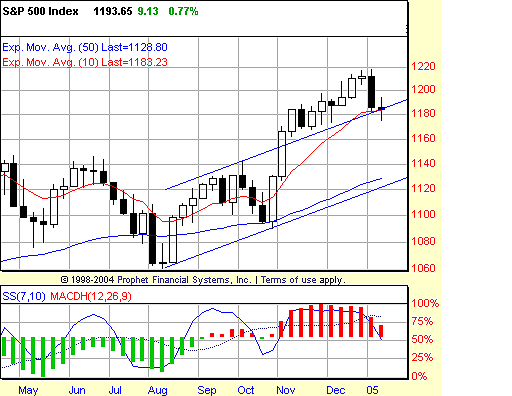
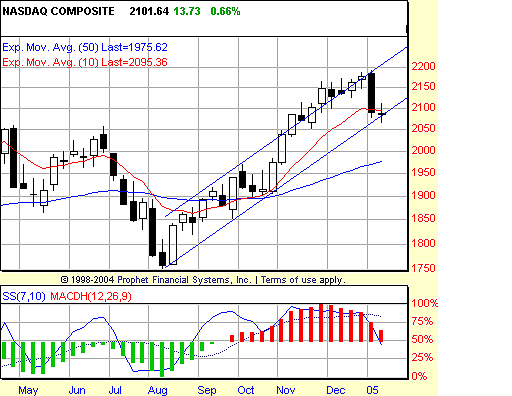
| If Markman didn't mind dipping into the netherworld of technical arcanae, then he could have even peeked at my Working-Money.com piece, "Elliott Wave 2005." There, I suggested that it was the bear market from January to August 2004 that was "dead in the water," and that higher stock prices in the S&P were just a correction away. I take Markman at his word. But looking at weekly charts of the Standard & Poor's 500 and Nasdaq over the weekend makes me wonder just which "major technical analysts" he is talking about. Both the S&P 500 and the Nasdaq have been moving around two bullish trend channels like water pumped through a pipe. And while the two markets have quite different relationships to their respective trend channels, I suspect they will share a bullish resolution. How so? Consider the two weekly charts of the S&P 500 and the Nasdaq below: |

|
| Figure 1: Finding support at the 10-week EMA as well as on the top of a trend channel's upper boundary, the S&P 500 still appears to be poised to move higher. |
| Graphic provided by: Prophet Financial, Inc. |
| |
 Figure 2: The Nasdaq. After breaking free from its trend channel in November, the Nasdaq falls back into the trend channel, reaching the lower band of the channel by mid-January. The S&P 500 was in a trend channel since making its low for 2004 in August. This market broke out of its channel in early November and used the top of the channel as support in a classic resistance-turned-support maneuver (see my Traders.com Advantage article from December 10, 2004, "Testing The Channel" for more on how this unfolded). As January 2005 arrived, the S&P 500 broke down sharply, yet formed a doji-pattern at the weekly pattern just as the breakdown was approaching support on the back of the old August 2004 trend channel. This doji--appearing both at the top of the trend channel from the outside as well as at the 10-week exponential moving average (in red)--may prove to be the signal that the correction in the bull market that began five months ago is almost over. |
| In the Nasdaq, the trend channel begins in those same August lows, and as with the S&P 500, it was in November that this market accelerated, closing above the upper boundary of the trend channel. However, in this case, the Nasdaq was never able to turn that upper boundary into support in the way that the S&P 500 did after it broke out in November. Although the Nasdaq managed to close above that trend channel on a weekly basis, there were several intraweek/daily penetrations of that boundary to the downside. Again, it is important to say that weekly closes in the Nasdaq remained above the boundary. But the fact that there was intraweek trading below the boundary indicates a relative weakness in the Nasdaq compared to the S&P 500. That said, consider where the Nasdaq is trading as of January 14, 2004. Like the S&P 500, the Nasdaq formed a doji on that day--and a doji at support, no less. However, whereas the S&P 500's doji was formed on the back of its August-to-present trend channel in the resistance-turned-support maneuver, the Nasdaq's doji sits on support at the lower band of its August-to-present trend channel. |
| From here, the S&P 500 could plunge down back into its trend channel--or the Nasdaq could fall right out through the bottom of its channel. But how would these developments--as dramatic as they may be--affect the bull markets both the S&P 500 and the Nasdaq? Arguably, the answer is not very much. The S&P 500 could fall all the way back to the bottom of its August trend channel and its bull market from the lows of that month would remain intact. As for the Nasdaq, continued lows would likely mean that the Nasdaq's performance during November and December (like the S&P 500) was overperformance. But even a retracement to the 50-week exponential moving average would not create a lower low in the August advance. The litmus test for the bull markets that began in August in both the S&P 500 and the Nasdaq is continued new weekly highs. If the weekly dojis of January 14 hold, then traders may see those new weekly highs far sooner than the bears would have them believe. |
Technical Writer for Technical Analysis of STOCKS & COMMODITIES magazine, Working-Money.com, and Traders.com Advantage.
| Title: | Technical Writer |
| Company: | Technical Analysis, Inc. |
| Address: | 4757 California Avenue SW |
| Seattle, WA 98116 | |
| Phone # for sales: | 206 938 0570 |
| Fax: | 206 938 1307 |
| Website: | www.Traders.com |
| E-mail address: | DPenn@traders.com |
Traders' Resource Links | |
| Charting the Stock Market: The Wyckoff Method -- Books | |
| Working-Money.com -- Online Trading Services | |
| Traders.com Advantage -- Online Trading Services | |
| Technical Analysis of Stocks & Commodities -- Publications and Newsletters | |
| Working Money, at Working-Money.com -- Publications and Newsletters | |
| Traders.com Advantage -- Publications and Newsletters | |
| Professional Traders Starter Kit -- Software | |
Click here for more information about our publications!
Comments
Date: 01/18/05Rank: 3Comment:
Date: 01/23/05Rank: 5Comment:
Date: 02/03/05Rank: 3Comment:

Request Information From Our Sponsors
- StockCharts.com, Inc.
- Candle Patterns
- Candlestick Charting Explained
- Intermarket Technical Analysis
- John Murphy on Chart Analysis
- John Murphy's Chart Pattern Recognition
- John Murphy's Market Message
- MurphyExplainsMarketAnalysis-Intermarket Analysis
- MurphyExplainsMarketAnalysis-Visual Analysis
- StockCharts.com
- Technical Analysis of the Financial Markets
- The Visual Investor
- VectorVest, Inc.
- Executive Premier Workshop
- One-Day Options Course
- OptionsPro
- Retirement Income Workshop
- Sure-Fire Trading Systems (VectorVest, Inc.)
- Trading as a Business Workshop
- VectorVest 7 EOD
- VectorVest 7 RealTime/IntraDay
- VectorVest AutoTester
- VectorVest Educational Services
- VectorVest OnLine
- VectorVest Options Analyzer
- VectorVest ProGraphics v6.0
- VectorVest ProTrader 7
- VectorVest RealTime Derby Tool
- VectorVest Simulator
- VectorVest Variator
- VectorVest Watchdog
