HOT TOPICS LIST
- MACD
- Fibonacci
- RSI
- Gann
- ADXR
- Stochastics
- Volume
- Triangles
- Futures
- Cycles
- Volatility
- ZIGZAG
- MESA
- Retracement
- Aroon
INDICATORS LIST
LIST OF TOPICS
PRINT THIS ARTICLE
by Kevin Hopson
A bullish consolidation pattern could lead to much higher prices for ExxonMobil, but traders should wait for confirmation before going long.
Position: Hold
Kevin Hopson
Kevin has been a technical analyst for roughly 10 years now. Previously, Kevin owned his own business and acted as a registered investment advisor, specializing in energy. He was also a freelance oil analyst for Orient Trading Co., a commodity futures trading firm in Japan. Kevin is currently a freelance writer.
PRINT THIS ARTICLE
TECHNICAL ANALYSIS
A Trading Range For ExxonMobil
01/17/05 11:06:51 AMby Kevin Hopson
A bullish consolidation pattern could lead to much higher prices for ExxonMobil, but traders should wait for confirmation before going long.
Position: Hold
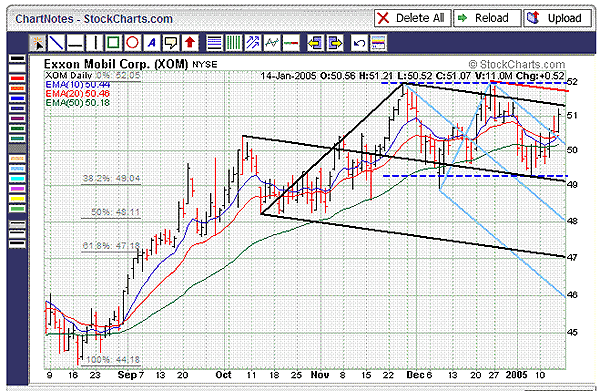
| ExxonMobil Corp. (XOM) has continued to rally after putting in a bottom last August. However, note how the stock has been stuck in a trading range between $49.00 and $52.00 since late November, as illustrated by the dotted blue lines in Figure 1. Trading ranges tend to be continuation patterns. Because the trend is up, it is likely that ExxonMobil will break out of this trading range and move higher again. Obviously, this is not guaranteed, but if you keep your eye on some key price levels, you should get a sense for which way the stock will break. |
| For example, note how prices failed to test the median line of the blue pitchfork before testing the top parallel line. This pattern is known as the "price failure" rule, which indicated strength for ExxonMobil. More specifically, a break of the top parallel line was predicted. As you can see, ExxonMobil recently broke to the upside from the falling pitchfork configuration, thus confirming this theory. |

|
| Figure 1: ExxonMobil. XOM has continued to rally after putting in a bottom last August. However, note how the stock has been stuck in a trading range between $49.00 and $52.00 since late November, as illustrated by the dotted blue lines here. |
| Graphic provided by: StockCharts.com. |
| |
| Now that this has occurred, the stock faces further resistance around the $51.40 level, which is the site of the top black parallel line. Even if ExxonMobil can overcome resistance here, the sliding red parallel line (warning line) from the December high and the top of the trading range both come into play in the $51.80 to $52.00 range. In other words, if ExxonMobil can clear resistance in the $51.40 to $52.00 range, it will be a signal to go long. In addition, a trading range breakout (on the next test of the top channel line) would indicate a potential upside target of between $57.00 and $60.00. For details on how to calculate trading range breakout price targets, please refer to my prior articles on the subject. |
| On the other hand, the stock should find significant support around the $49.00 level. This is the site of the 38.2% retracement level ($49.04) from the August to November rally, the black median line, and the bottom of the current trading range. If support here fails to hold, ExxonMobil will likely see a further pullback to the $48.00 level, which is the site of the blue median line and the 50% retracement ($48.11) from the August to November rally. In the meantime, I would continue to hold and await further developments. |
Kevin has been a technical analyst for roughly 10 years now. Previously, Kevin owned his own business and acted as a registered investment advisor, specializing in energy. He was also a freelance oil analyst for Orient Trading Co., a commodity futures trading firm in Japan. Kevin is currently a freelance writer.
| Glen Allen, VA | |
| E-mail address: | hopson_1@yahoo.com |
Click here for more information about our publications!
Comments
Date: 01/17/05Rank: 2Comment:
Date: 01/18/05Rank: 4Comment:
Date: 02/03/05Rank: 4Comment:

|

Request Information From Our Sponsors
- StockCharts.com, Inc.
- Candle Patterns
- Candlestick Charting Explained
- Intermarket Technical Analysis
- John Murphy on Chart Analysis
- John Murphy's Chart Pattern Recognition
- John Murphy's Market Message
- MurphyExplainsMarketAnalysis-Intermarket Analysis
- MurphyExplainsMarketAnalysis-Visual Analysis
- StockCharts.com
- Technical Analysis of the Financial Markets
- The Visual Investor
- VectorVest, Inc.
- Executive Premier Workshop
- One-Day Options Course
- OptionsPro
- Retirement Income Workshop
- Sure-Fire Trading Systems (VectorVest, Inc.)
- Trading as a Business Workshop
- VectorVest 7 EOD
- VectorVest 7 RealTime/IntraDay
- VectorVest AutoTester
- VectorVest Educational Services
- VectorVest OnLine
- VectorVest Options Analyzer
- VectorVest ProGraphics v6.0
- VectorVest ProTrader 7
- VectorVest RealTime Derby Tool
- VectorVest Simulator
- VectorVest Variator
- VectorVest Watchdog
