HOT TOPICS LIST
- MACD
- Fibonacci
- RSI
- Gann
- ADXR
- Stochastics
- Volume
- Triangles
- Futures
- Cycles
- Volatility
- ZIGZAG
- MESA
- Retracement
- Aroon
INDICATORS LIST
LIST OF TOPICS
PRINT THIS ARTICLE
by Kevin Hopson
A bottom reversal has occurred, but what is its magnitude?
Position: Hold
Kevin Hopson
Kevin has been a technical analyst for roughly 10 years now. Previously, Kevin owned his own business and acted as a registered investment advisor, specializing in energy. He was also a freelance oil analyst for Orient Trading Co., a commodity futures trading firm in Japan. Kevin is currently a freelance writer.
PRINT THIS ARTICLE
WEDGE FORMATIONS
A Bottom For Meridian Resources?
01/17/05 08:15:45 AMby Kevin Hopson
A bottom reversal has occurred, but what is its magnitude?
Position: Hold
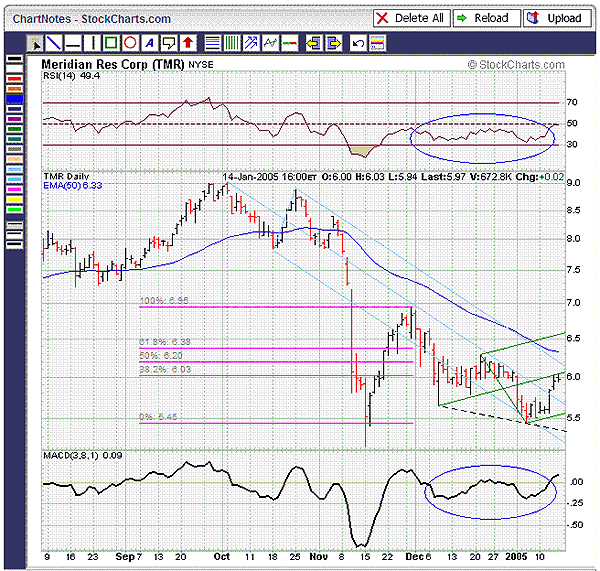
| As you can see in the five-month chart (Figure 1), Meridian Resources Corp. (TMR) took a nosedive last November, shedding nearly 40% of its value. Since then, however, the stock has shown signs of putting in a bottom. For example, note how Meridian formed a falling wedge from the beginning of December to early January. This is illustrated by the dotted black line and the blue median line. Just to clarify, the blue median line actually overlaps November's downtrend line (or the top of the falling wedge formation). As a result, it may be difficult to recognize the falling wedge at first sight. |
| In any event, the falling wedge formation was a good sign, the reason being that this pattern tends to be bullish. In other words, more times than not, prices will break to the upside. In addition, notice how the relative strength index (RSI) and the moving average convergence/divergence (MACD) both held their December lows, even though the stock price did not. These bullish divergences, coupled with the falling wedge formation, signaled a forthcoming bottom. As you can see, Meridian has broken to the upside, thus confirming a bottom reversal. |

|
| Figure 1: Meridian five-month chart. As you can see, Meridian Resources took a nosedive last November, shedding nearly 40% of its value. |
| Graphic provided by: StockCharts.com. |
| |
| Unfortunately, the stock is now bumping up against resistance. More specifically, the green median line and the 38.2% retracement level ($6.03) from the November high to January low have both converged here. Even if Meridian can overcome resistance, there are two other problematic areas. One is the $6.20 level, which is the site of the top blue parallel line and the 50% retracement from the November to January decline. The other is the $6.33 to $6.38 range. This is the site of the stock's 50-day moving average ($6.33) and the 61.8% retracement level ($6.38) from the recent decline. As a result, it will take a move above the $6.38 level for Meridian to confirm a significant bottom. In the meantime, I would continue to hold and await further developments. |
Kevin has been a technical analyst for roughly 10 years now. Previously, Kevin owned his own business and acted as a registered investment advisor, specializing in energy. He was also a freelance oil analyst for Orient Trading Co., a commodity futures trading firm in Japan. Kevin is currently a freelance writer.
| Glen Allen, VA | |
| E-mail address: | hopson_1@yahoo.com |
Click here for more information about our publications!
Comments
Date: 01/17/05Rank: 3Comment:
Date: 02/03/05Rank: 4Comment:

Request Information From Our Sponsors
- StockCharts.com, Inc.
- Candle Patterns
- Candlestick Charting Explained
- Intermarket Technical Analysis
- John Murphy on Chart Analysis
- John Murphy's Chart Pattern Recognition
- John Murphy's Market Message
- MurphyExplainsMarketAnalysis-Intermarket Analysis
- MurphyExplainsMarketAnalysis-Visual Analysis
- StockCharts.com
- Technical Analysis of the Financial Markets
- The Visual Investor
- VectorVest, Inc.
- Executive Premier Workshop
- One-Day Options Course
- OptionsPro
- Retirement Income Workshop
- Sure-Fire Trading Systems (VectorVest, Inc.)
- Trading as a Business Workshop
- VectorVest 7 EOD
- VectorVest 7 RealTime/IntraDay
- VectorVest AutoTester
- VectorVest Educational Services
- VectorVest OnLine
- VectorVest Options Analyzer
- VectorVest ProGraphics v6.0
- VectorVest ProTrader 7
- VectorVest RealTime Derby Tool
- VectorVest Simulator
- VectorVest Variator
- VectorVest Watchdog
