HOT TOPICS LIST
- MACD
- Fibonacci
- RSI
- Gann
- ADXR
- Stochastics
- Volume
- Triangles
- Futures
- Cycles
- Volatility
- ZIGZAG
- MESA
- Retracement
- Aroon
INDICATORS LIST
LIST OF TOPICS
PRINT THIS ARTICLE
by Koos van der Merwe
Here's a short-term outlook to Pfizer, using short-term indicators.
Position: Hold
Koos van der Merwe
Has been a technical analyst since 1969, and has worked as a futures and options trader with First Financial Futures in Johannesburg, South Africa.
PRINT THIS ARTICLE
TECHNICAL INDICATORS
Looking At Pfizer On A Shorter Time Scale
01/13/05 11:41:53 AMby Koos van der Merwe
Here's a short-term outlook to Pfizer, using short-term indicators.
Position: Hold
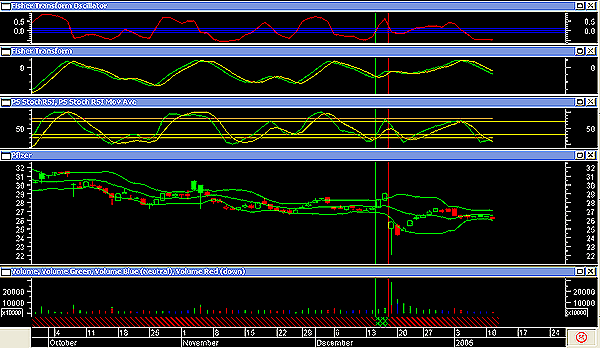
| Yesterday, I wrote an article on the prospect of investing in Pfizer Laboratories for the long term, now that the share price has dropped considerably after their negative announcement with regard to Celebrex. This article gives you my short-term outlook, using short-term indicators not that readily available but found in Technical Analysis of STOCKS & COMMODITIES. The price of the chart is in candlestick format, as seen in the lower pane of Figure 1. The candlesticks are colored as follows: If a closing price is higher than the opening price, the candlestick is green, and if the closing price is lower than the open price, the candlestick is red. This is so you can instantly recognize the daily trend. I will also look at candlestick patterns to assist me in my decision-making. I have also added Bollinger Bands (in green) to the chart so I will be warned should a possible breakout occur after the bands have narrowed. The direction of the breakout can be suggested by the other indicators in the chart. Do remember that a narrowing of the bands tells you that volatility has decreased. |
| Not only that, I added the Fisher transform. This indicator was published in STOCKS & COMMODITIES magazine in November 2002 by John F Ehlers as "Using The Fisher Transform." Anything that Ehlers publishes I examine closely. This is one indicator that I have found very useful for short-term trading. I developed an oscillator of the Fisher transform indicator that acts as an early warning system. The oscillator is a one-day rate of change and is plotted in the top indicator window. I have drawn in the zero line in blue, and two other lines 1% above and below the zero line. When the oscillator breaks the lower line, then I am warned to watch for a future buy signal, and vice versa. |

|
| Figure 1: Pfizer and its decision-making indicators. This article gives you a short-term outlook for this stock, using short-term indicators not that readily available but found in STOCKS & COMMODITIES. |
| Graphic provided by: MetaStock. |
| |
| The next indicator is the standard stochastic relative strength index (RSI) oscillator found in most analytical programs of today. I refer to this oscillator for overall direction of the price--for example, I will never purchase a stock even if the Fisher oscillator suggests a buy when the stochastic RSI oscillator is above the 60 level. Volume: I have applied the volume flow indicator (VFI) written by Markos Katsanos in the June 2004 STOCKS & COMMODITIES. The MetaStock formulas are in the article. The VFI is a long-term indicator that helps you assess the major trend of the stock. This way, you can stay with the trend and avoid short-term noise and bearish signals from various short term oscillators. |
| In the same window, below the volume is the "bull power bear power" chart supplied by MetaStock. This is another long-term trend indicator. I will continually refer to it before I make my final decision to trade as a reminder of the stock's underlying trend. Have all these indicators in a chart made me a ton of money? No, but they have put the odds in my favor. After running various explorations and reducing those stocks for me to watch to three or four, I will examine the stock using these indicators. Should I decide that the stock is one I would like to purchase, I first look at what the insiders are doing. Here, I go to http://partners.thomsonfn.com/FindLaw/stockquote/, which I have found an excellent website. If insiders are buying, then my decision to purchase the stock is strengthened. |
| My final decision is made the morning after the market has opened, at what price I should place my bid or offer. Here I look at a one-minute and three-minute chart, with a 10-period RSI and moving average convergence/divergence (MACD) indicators to determine my entry point. All the formulas that I have used here are available in TASC. Should you want further details, please email me. |
Has been a technical analyst since 1969, and has worked as a futures and options trader with First Financial Futures in Johannesburg, South Africa.
| Address: | 3256 West 24th Ave |
| Vancouver, BC | |
| Phone # for sales: | 6042634214 |
| E-mail address: | petroosp@gmail.com |
Click here for more information about our publications!
Comments
Date: 01/15/05Rank: 3Comment:
Date: 02/01/05Rank: 3Comment:

|

Request Information From Our Sponsors
- StockCharts.com, Inc.
- Candle Patterns
- Candlestick Charting Explained
- Intermarket Technical Analysis
- John Murphy on Chart Analysis
- John Murphy's Chart Pattern Recognition
- John Murphy's Market Message
- MurphyExplainsMarketAnalysis-Intermarket Analysis
- MurphyExplainsMarketAnalysis-Visual Analysis
- StockCharts.com
- Technical Analysis of the Financial Markets
- The Visual Investor
- VectorVest, Inc.
- Executive Premier Workshop
- One-Day Options Course
- OptionsPro
- Retirement Income Workshop
- Sure-Fire Trading Systems (VectorVest, Inc.)
- Trading as a Business Workshop
- VectorVest 7 EOD
- VectorVest 7 RealTime/IntraDay
- VectorVest AutoTester
- VectorVest Educational Services
- VectorVest OnLine
- VectorVest Options Analyzer
- VectorVest ProGraphics v6.0
- VectorVest ProTrader 7
- VectorVest RealTime Derby Tool
- VectorVest Simulator
- VectorVest Variator
- VectorVest Watchdog
