HOT TOPICS LIST
- MACD
- Fibonacci
- RSI
- Gann
- ADXR
- Stochastics
- Volume
- Triangles
- Futures
- Cycles
- Volatility
- ZIGZAG
- MESA
- Retracement
- Aroon
INDICATORS LIST
LIST OF TOPICS
PRINT THIS ARTICLE
by Arthur Hill
Micron Tech has underperformed the market over the last few months and appears on the verge of moving even lower.
Position: Hold
Arthur Hill
Arthur Hill is currently editor of TDTrader.com, a website specializing in trading strategies, sector/industry specific breadth stats and overall technical analysis. He passed the Society of Technical Analysts (STA London) diploma exam with distinction is a Certified Financial Technician (CFTe). Prior to TD Trader, he was the Chief Technical Analyst for Stockcharts.com and the main contributor to the ChartSchool.
PRINT THIS ARTICLE
DESCENDING TRIANGLES
The Noose Tightens For Micron Tech
01/13/05 08:48:12 AMby Arthur Hill
Micron Tech has underperformed the market over the last few months and appears on the verge of moving even lower.
Position: Hold
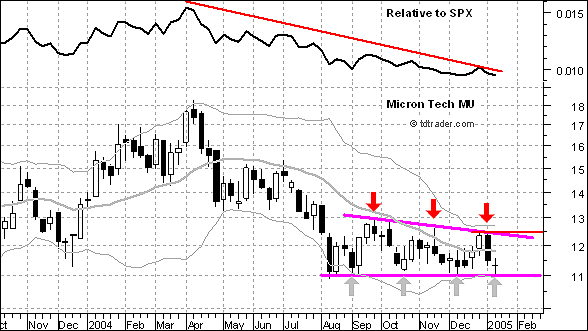
| While the Nasdaq and Standard & Poor's 500 surged from mid-August to late December, Micron Technology remained in a trading range. During this period, the Nasdaq rose over 20% and the S&P 500 advanced around 14%. Conversely, MU remained range bound and has little to show for this explosive move in the broader market. The price relative, which compares the performance of MU against the S&P 500, peaked in April and has moved steadily lower over the last several months. |
| On the price channel, the pattern at work looks like a descending triangle. These are bearish continuation patterns that are confirmed with a support break. The lower highs show selling pressure at lower and lower levels (red arrow). The equal lows show buying pressure around 11. A move below 11 would break the bull's back and open the door to single digits. |

|
| Figure 1: Micron Tech. MU has underperformed the market over the last few months and appears on the verge of moving even lower. |
| Graphic provided by: MetaStock. |
| Graphic provided by: Reuters Data. |
| |
| Bollinger Bands confirm that a break is imminent. These volatility-based bands contract as trading becomes relatively confined. The bands were quite wide from December to August, which represented a period of movement. However, the bands have tightened to their narrowest levels in over a year. This indicator does not have a directional bias, and the next signal depends on the direction of the break. A break above the last high (12.44) would be bullish, while a break below the last low (11) would be bearish. |
Arthur Hill is currently editor of TDTrader.com, a website specializing in trading strategies, sector/industry specific breadth stats and overall technical analysis. He passed the Society of Technical Analysts (STA London) diploma exam with distinction is a Certified Financial Technician (CFTe). Prior to TD Trader, he was the Chief Technical Analyst for Stockcharts.com and the main contributor to the ChartSchool.
| Title: | Editor |
| Company: | TDTrader.com |
| Address: | Willem Geetsstraat 17 |
| Mechelen, B2800 | |
| Phone # for sales: | 3215345465 |
| Website: | www.tdtrader.com |
| E-mail address: | arthurh@tdtrader.com |
Traders' Resource Links | |
| TDTrader.com has not added any product or service information to TRADERS' RESOURCE. | |
Click here for more information about our publications!
Comments
Date: 01/15/05Rank: 5Comment:
Date: 02/01/05Rank: 4Comment:

Request Information From Our Sponsors
- VectorVest, Inc.
- Executive Premier Workshop
- One-Day Options Course
- OptionsPro
- Retirement Income Workshop
- Sure-Fire Trading Systems (VectorVest, Inc.)
- Trading as a Business Workshop
- VectorVest 7 EOD
- VectorVest 7 RealTime/IntraDay
- VectorVest AutoTester
- VectorVest Educational Services
- VectorVest OnLine
- VectorVest Options Analyzer
- VectorVest ProGraphics v6.0
- VectorVest ProTrader 7
- VectorVest RealTime Derby Tool
- VectorVest Simulator
- VectorVest Variator
- VectorVest Watchdog
- StockCharts.com, Inc.
- Candle Patterns
- Candlestick Charting Explained
- Intermarket Technical Analysis
- John Murphy on Chart Analysis
- John Murphy's Chart Pattern Recognition
- John Murphy's Market Message
- MurphyExplainsMarketAnalysis-Intermarket Analysis
- MurphyExplainsMarketAnalysis-Visual Analysis
- StockCharts.com
- Technical Analysis of the Financial Markets
- The Visual Investor
