HOT TOPICS LIST
- MACD
- Fibonacci
- RSI
- Gann
- ADXR
- Stochastics
- Volume
- Triangles
- Futures
- Cycles
- Volatility
- ZIGZAG
- MESA
- Retracement
- Aroon
INDICATORS LIST
LIST OF TOPICS
PRINT THIS ARTICLE
by Kevin Hopson
As expected, Honeywell bounced off key support this week. Now the stock faces short-term resistance.
Position: Hold
Kevin Hopson
Kevin has been a technical analyst for roughly 10 years now. Previously, Kevin owned his own business and acted as a registered investment advisor, specializing in energy. He was also a freelance oil analyst for Orient Trading Co., a commodity futures trading firm in Japan. Kevin is currently a freelance writer.
PRINT THIS ARTICLE
TECHNICAL ANALYSIS
An Update On Honeywell International
01/13/05 08:44:02 AMby Kevin Hopson
As expected, Honeywell bounced off key support this week. Now the stock faces short-term resistance.
Position: Hold
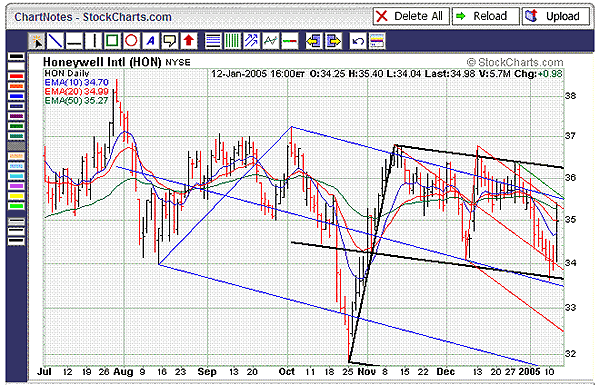
| I touched on Honeywell International (HON) just last week. At that time, I recommended holding onto shares of Honeywell, as a significant confluence of support was coming into play at slightly lower levels. Because prices were hugging the median line of the red pitchfork (support was weakening), I said a break of this trendline was likely--and this came to fruition. Once this occurred, I said to look for a bounce in the $33.60 to $33.80 range. This is the site of the blue median line, black median line, and the 61.8% retracement level from the October to December rally. As expected, this area of support held. |
| Now that prices have rallied, the stock is facing resistance, as opposed to support. For example, note how prices are bumping up against the top parallel line of the red pitchfork. This is also the site of the stock's 50-day moving average ($35.27). Even if Honeywell can make its way above resistance here, there is additional overhead around the $35.50 level. This is the site of the top blue parallel line and the sliding green parallel line. |

|
| Figure 1: Honeywell International. As expected, Honeywell bounced off key support this week. Now the stock faces short-term resistance. |
| Graphic provided by: StockCharts.com. |
| |
| When prices moved above the top red parallel line in late December, a warning line (green line) was drawn from the high. This is done to give prices the benefit of the doubt. In other words, if Honeywell can breach this warning line, a breakout will be confirmed and a short-term buy signal will be given. In addition, the stock could eventually make its way up to the $36.20 level, which is the site of the top black parallel line. As a result, I would continue to hold shares of Honeywell International and await further developments. |
Kevin has been a technical analyst for roughly 10 years now. Previously, Kevin owned his own business and acted as a registered investment advisor, specializing in energy. He was also a freelance oil analyst for Orient Trading Co., a commodity futures trading firm in Japan. Kevin is currently a freelance writer.
| Glen Allen, VA | |
| E-mail address: | hopson_1@yahoo.com |
Click here for more information about our publications!
Comments
Date: 01/15/05Rank: 2Comment:
Date: 02/01/05Rank: 3Comment:

|

Request Information From Our Sponsors
- StockCharts.com, Inc.
- Candle Patterns
- Candlestick Charting Explained
- Intermarket Technical Analysis
- John Murphy on Chart Analysis
- John Murphy's Chart Pattern Recognition
- John Murphy's Market Message
- MurphyExplainsMarketAnalysis-Intermarket Analysis
- MurphyExplainsMarketAnalysis-Visual Analysis
- StockCharts.com
- Technical Analysis of the Financial Markets
- The Visual Investor
- VectorVest, Inc.
- Executive Premier Workshop
- One-Day Options Course
- OptionsPro
- Retirement Income Workshop
- Sure-Fire Trading Systems (VectorVest, Inc.)
- Trading as a Business Workshop
- VectorVest 7 EOD
- VectorVest 7 RealTime/IntraDay
- VectorVest AutoTester
- VectorVest Educational Services
- VectorVest OnLine
- VectorVest Options Analyzer
- VectorVest ProGraphics v6.0
- VectorVest ProTrader 7
- VectorVest RealTime Derby Tool
- VectorVest Simulator
- VectorVest Variator
- VectorVest Watchdog
