HOT TOPICS LIST
- MACD
- Fibonacci
- RSI
- Gann
- ADXR
- Stochastics
- Volume
- Triangles
- Futures
- Cycles
- Volatility
- ZIGZAG
- MESA
- Retracement
- Aroon
INDICATORS LIST
LIST OF TOPICS
PRINT THIS ARTICLE
by Kevin Hopson
Devon Energy faces a tough task in the near term.
Position: Hold
Kevin Hopson
Kevin has been a technical analyst for roughly 10 years now. Previously, Kevin owned his own business and acted as a registered investment advisor, specializing in energy. He was also a freelance oil analyst for Orient Trading Co., a commodity futures trading firm in Japan. Kevin is currently a freelance writer.
PRINT THIS ARTICLE
TECHNICAL ANALYSIS
Devon Energy Testing Key Resistance
01/12/05 08:24:58 AMby Kevin Hopson
Devon Energy faces a tough task in the near term.
Position: Hold
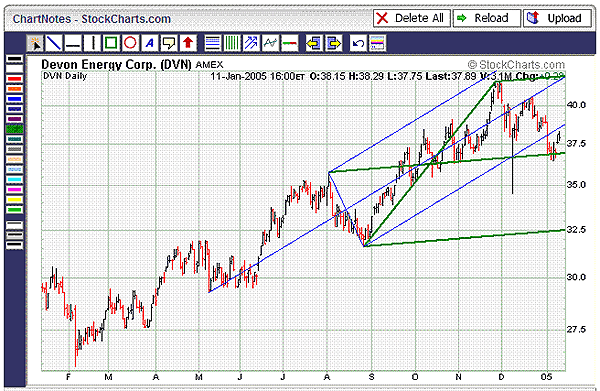
| If you look at the one-year chart for Devon Energy (DVN) (Figure 1), you will see that the stock has been in a strong uptrend since February 2004. However, as you probably know, bull markets tend to see corrections every now and then. As a result, it should be no surprise that Devon has pulled back the last six weeks after hitting a 52-week high in late November. The debate now is when the technicals will start turning up again. |
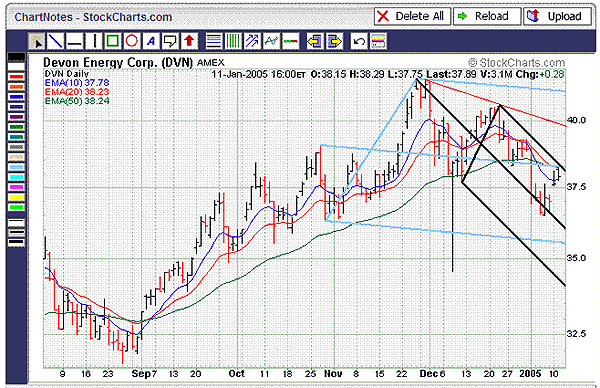
| If you turn your attention to the six-month chart (Figure 2), it will shed some light on the matter. For example, note how the top black parallel line, blue median line, 20-day moving average ($38.23), and 50-day moving average ($38.24) have all converged around the $38.25 level. Given the confluence of resistance here, this price level will be a significant barrier for Devon in the near term. |

|
| Figure 1: One-year chart of Devon Energy. A quick glance at this stock suggests that it has been in a strong uptrend since February 2004. |
| Graphic provided by: StockCharts.com. |
| |
 Figure 2: Six-month chart, Devon Energy In addition, if you look back at the one-year chart, you will see that prices are coming up on the bottom blue parallel line (~$38.50). Since Devon broke support here in early January, this trendline could turn into resistance now. Further, the 50% retracement level from the December 2004 to January 2005 decline resides here. As a result, if Devon can overcome key resistance in the $38.25 to $38.50 range, the short-term picture will turn bullish. November's downtrend line (red line) around the $40.00 level would be a possible upside target in the near term. |
Kevin has been a technical analyst for roughly 10 years now. Previously, Kevin owned his own business and acted as a registered investment advisor, specializing in energy. He was also a freelance oil analyst for Orient Trading Co., a commodity futures trading firm in Japan. Kevin is currently a freelance writer.
| Glen Allen, VA | |
| E-mail address: | hopson_1@yahoo.com |
Click here for more information about our publications!
Comments
Date: 01/12/05Rank: 2Comment:
Date: 02/01/05Rank: 3Comment:

Request Information From Our Sponsors
- StockCharts.com, Inc.
- Candle Patterns
- Candlestick Charting Explained
- Intermarket Technical Analysis
- John Murphy on Chart Analysis
- John Murphy's Chart Pattern Recognition
- John Murphy's Market Message
- MurphyExplainsMarketAnalysis-Intermarket Analysis
- MurphyExplainsMarketAnalysis-Visual Analysis
- StockCharts.com
- Technical Analysis of the Financial Markets
- The Visual Investor
- VectorVest, Inc.
- Executive Premier Workshop
- One-Day Options Course
- OptionsPro
- Retirement Income Workshop
- Sure-Fire Trading Systems (VectorVest, Inc.)
- Trading as a Business Workshop
- VectorVest 7 EOD
- VectorVest 7 RealTime/IntraDay
- VectorVest AutoTester
- VectorVest Educational Services
- VectorVest OnLine
- VectorVest Options Analyzer
- VectorVest ProGraphics v6.0
- VectorVest ProTrader 7
- VectorVest RealTime Derby Tool
- VectorVest Simulator
- VectorVest Variator
- VectorVest Watchdog
