HOT TOPICS LIST
- MACD
- Fibonacci
- RSI
- Gann
- ADXR
- Stochastics
- Volume
- Triangles
- Futures
- Cycles
- Volatility
- ZIGZAG
- MESA
- Retracement
- Aroon
INDICATORS LIST
LIST OF TOPICS
PRINT THIS ARTICLE
by Koos van der Merwe
Drug companies have suddenly decided to bare their souls, and those of their drugs. Will they bounce back, and is the risk worth taking?
Position: Accumulate
Koos van der Merwe
Has been a technical analyst since 1969, and has worked as a futures and options trader with First Financial Futures in Johannesburg, South Africa.
PRINT THIS ARTICLE
MOVING AVERAGES
The Fate Of Pfizer
01/11/05 03:59:30 PMby Koos van der Merwe
Drug companies have suddenly decided to bare their souls, and those of their drugs. Will they bounce back, and is the risk worth taking?
Position: Accumulate
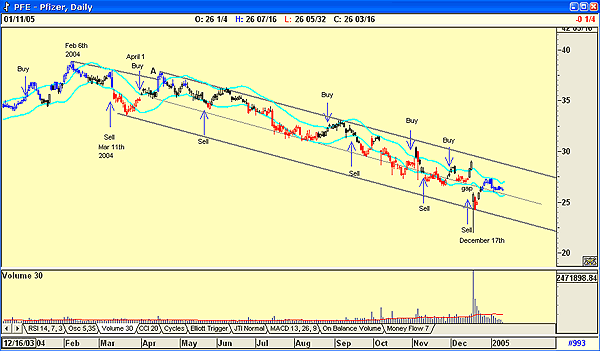
| On December 17, a long-term study found that patients taking large doses of Celebrex were two-and-a-half times more likely to suffer a cardiovascular problem than those not taking the drug. Pfizer shares dropped on the news, as the market anticipated that the drug would be removed from the market, as was Merck and Co.'s Vioxx, and that Pfizer's shares would be hurt. Today, conservative investors may want to steer clear of the stock, but aggressive investors could consider buying the share. What do the charts suggest? I spent hours trying to find an indicator that would have kept me out of Pfizer over the period, and the only ones that were successful were trendlines and the JM Internal band indicator. In Figure 1, the JM internal band indicator is a 15-period moving average offset by 2.5%. Figure 1 is from the high reached on February 6, 2004, to the present. Why has Pfizer fallen so consistently when the rest of the market moved up? The answer is obvious -- the drop in sales of its product Viagra as rival product Cialis ate into Pfizer's cash cow. Had you, as an investor, not been stopped out, you would have sold on March 11 as the price broke below the lower JM band. You may have even been tempted to a short sale, and the fact that the candlesticks on the chart had turned red -- an XTL sell signal -- would have tempted you even more. |
| The XTL indicator in Advanced GET is a simple but powerful tool that is not complicated to use. If the bars are blue, then the trend is up. If the bars are red, then the trend is down. When you have a bar turn from its normal color to blue or black, this first signal is called a breakout bar. An entry is taken when the bar following the breakout bar is the same trend color as the breakout bar, and the range exceeds 150% of the breakout bar in the direction of the trend. You would place a stop below the low of the breakout if the trend is up, and you would place a stop above the high of the breakout if the trend is down. As the market moves in the direction of the trend, you would use a trailing stop to follow the trend. |

|
| FIGURE 1: PFIZER. This chart is from the high reached on February 6, 2004, to the present. |
| Graphic provided by: AdvancedGET. |
| |
| Had you sold short, you would have been stopped out before the April 1st buy signal as the candlestick changed to black, and the price broke above the upper JM band line. You would also have cheered when the price broke above the trendline, and believed that you had bought into a strong rising trend, but your euphoria would have been short-lived as, two days later, Pfizer started a fall that could have bottomed on December 17. I say "could have" because although the price has changed to blue, it has not broken above the upper JM band to confirm the buy. Speculators, on the other hand, would have purchased on the gap breakdown and V-bottom that subsequently formed. |
| Now, what does the future hold? In its rise from the low to fill the gap, volume did not strengthen. Not a good sign, but the XTL blue of the price is encouraging. Another encouraging sign is that the price does appear to have found support on the median trendline. As a conservative investor, I would wait for a break above the upper JM internal band line before I bought, but more adventurous investors could wait for a move above the resistance at $27. A share to place on your watchlist. |
Has been a technical analyst since 1969, and has worked as a futures and options trader with First Financial Futures in Johannesburg, South Africa.
| Address: | 3256 West 24th Ave |
| Vancouver, BC | |
| Phone # for sales: | 6042634214 |
| E-mail address: | petroosp@gmail.com |
Click here for more information about our publications!
Comments
Date: 01/11/05Rank: 3Comment:
Date: 02/01/05Rank: 3Comment:

|

Request Information From Our Sponsors
- StockCharts.com, Inc.
- Candle Patterns
- Candlestick Charting Explained
- Intermarket Technical Analysis
- John Murphy on Chart Analysis
- John Murphy's Chart Pattern Recognition
- John Murphy's Market Message
- MurphyExplainsMarketAnalysis-Intermarket Analysis
- MurphyExplainsMarketAnalysis-Visual Analysis
- StockCharts.com
- Technical Analysis of the Financial Markets
- The Visual Investor
- VectorVest, Inc.
- Executive Premier Workshop
- One-Day Options Course
- OptionsPro
- Retirement Income Workshop
- Sure-Fire Trading Systems (VectorVest, Inc.)
- Trading as a Business Workshop
- VectorVest 7 EOD
- VectorVest 7 RealTime/IntraDay
- VectorVest AutoTester
- VectorVest Educational Services
- VectorVest OnLine
- VectorVest Options Analyzer
- VectorVest ProGraphics v6.0
- VectorVest ProTrader 7
- VectorVest RealTime Derby Tool
- VectorVest Simulator
- VectorVest Variator
- VectorVest Watchdog
