HOT TOPICS LIST
- MACD
- Fibonacci
- RSI
- Gann
- ADXR
- Stochastics
- Volume
- Triangles
- Futures
- Cycles
- Volatility
- ZIGZAG
- MESA
- Retracement
- Aroon
INDICATORS LIST
LIST OF TOPICS
PRINT THIS ARTICLE
by David Penn
Gold slipping, the dollar bouncing ... what do YOU think bonds are likely to do next?
Position: N/A
David Penn
Technical Writer for Technical Analysis of STOCKS & COMMODITIES magazine, Working-Money.com, and Traders.com Advantage.
PRINT THIS ARTICLE
THE DIAMOND
Bad News Bonds?
01/07/05 03:54:16 PMby David Penn
Gold slipping, the dollar bouncing ... what do YOU think bonds are likely to do next?
Position: N/A
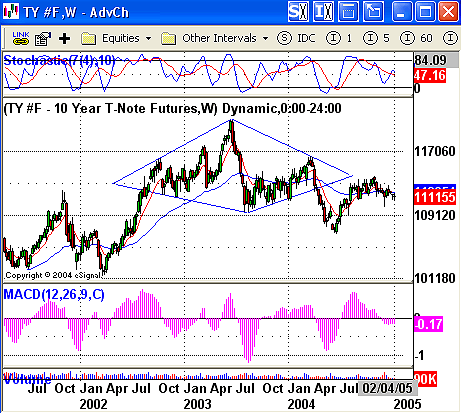
| I haven't paid a great deal of attention to the bond market since late October 2004. Looking at a chart of weekly continuous 10-year Treasury note futures from that time, the peak in the spring of 2003 stands out only a bit more starkly than the plunge in bond futures during the summer of 2003. Since that plunge, bond futures rallied weakly into 2004 before plunging again into the late spring. In 2004, the 10-year note rose with the same sort of fits-'n-starts rally that characterized the advance in the second half of 2003. However, by the autumn of 2004--just as stocks were bottoming--the 10-year note rolled over and began a mild decline. |
| That's where things stand now. But in some respects, the outlook for bonds today in January 2005 is little different from the outlook back in October 2004. Back then, the dominant technical development was a massive diamond pattern--a diamond top, most likely--that began with the advance in the Treasury note back in 2002. From this perspective, the move down in the first half of 2004 appears to have been a downside break from this diamond, and the fact that the reaction (the bounce from the spring of 2004 until that autumn) has been so underwhelming only underscores the likelihood that the downside break was real and the potential for significant declines in the near term all the more probable. |

|
| Figure 1: If this Death Star-like diamond top in the 10-year Treasury note proves to be valid, then it won't be just bond traders and fixed-income investors who feel the pressure of higher long-term interest rates. |
| Graphic provided by: eSignal. |
| |
| Today on his radio show, trader and money manager Gary Kaltbaum made the point that there is really little to be gained by attempting to be the uber-guru who calls THE TOP or THE BOTTOM in any given market. His argument, which Kaltbaum has repeated consistently over the years, is that if you follow the market closely on a day-to-day basis, focusing on interpretation rather than prediction, then you will be out of the market when you need to be out of the market, and be in the market when you need to be in. If being in the market is right, then you'll catch those great bull market runs that stretch on for months and even years. And if being out of the market is right, then you'll avoid those nasty bear market collapses that can ruin even a lifetime of otherwise sound investing. |
| Kaltbaum's observation rings all the more true as I look at this diamond top in the 10-year note. It is difficult to believe the kind of bear market this pattern seems to be suggesting could be right around the corner. In fact, it is difficult to believe that even those who have breezily suggested that interest rates are likely to go higher in 2005 have anything in mind like what this diamond top is projecting. Why so? Because the most fundamental measurement of this pattern--highest point to lowest point--gives a formation size of 11 '10.5 points (362.5 ticks), and that amount subtracted from the value at the likely breakdown level of 112 '16 suggests a minimum downside of 101 %916.5. |
| The last time the 10-year note was at this level? Late 2000. Ten-year rates at the time? Between 5% and 6%. |
Technical Writer for Technical Analysis of STOCKS & COMMODITIES magazine, Working-Money.com, and Traders.com Advantage.
| Title: | Technical Writer |
| Company: | Technical Analysis, Inc. |
| Address: | 4757 California Avenue SW |
| Seattle, WA 98116 | |
| Phone # for sales: | 206 938 0570 |
| Fax: | 206 938 1307 |
| Website: | www.Traders.com |
| E-mail address: | DPenn@traders.com |
Traders' Resource Links | |
| Charting the Stock Market: The Wyckoff Method -- Books | |
| Working-Money.com -- Online Trading Services | |
| Traders.com Advantage -- Online Trading Services | |
| Technical Analysis of Stocks & Commodities -- Publications and Newsletters | |
| Working Money, at Working-Money.com -- Publications and Newsletters | |
| Traders.com Advantage -- Publications and Newsletters | |
| Professional Traders Starter Kit -- Software | |
Click here for more information about our publications!
Comments
Date: 01/08/05Rank: 3Comment:
Date: 01/10/05Rank: 4Comment:

|

Request Information From Our Sponsors
- StockCharts.com, Inc.
- Candle Patterns
- Candlestick Charting Explained
- Intermarket Technical Analysis
- John Murphy on Chart Analysis
- John Murphy's Chart Pattern Recognition
- John Murphy's Market Message
- MurphyExplainsMarketAnalysis-Intermarket Analysis
- MurphyExplainsMarketAnalysis-Visual Analysis
- StockCharts.com
- Technical Analysis of the Financial Markets
- The Visual Investor
- VectorVest, Inc.
- Executive Premier Workshop
- One-Day Options Course
- OptionsPro
- Retirement Income Workshop
- Sure-Fire Trading Systems (VectorVest, Inc.)
- Trading as a Business Workshop
- VectorVest 7 EOD
- VectorVest 7 RealTime/IntraDay
- VectorVest AutoTester
- VectorVest Educational Services
- VectorVest OnLine
- VectorVest Options Analyzer
- VectorVest ProGraphics v6.0
- VectorVest ProTrader 7
- VectorVest RealTime Derby Tool
- VectorVest Simulator
- VectorVest Variator
- VectorVest Watchdog
