HOT TOPICS LIST
- MACD
- Fibonacci
- RSI
- Gann
- ADXR
- Stochastics
- Volume
- Triangles
- Futures
- Cycles
- Volatility
- ZIGZAG
- MESA
- Retracement
- Aroon
INDICATORS LIST
LIST OF TOPICS
PRINT THIS ARTICLE
by Andrew Hetherington
This tradable looks like it should be watched closely.
Position: N/A
Andrew Hetherington
Classic Dow Theorist who trades as a pure technician, using pattern recognition.
PRINT THIS ARTICLE
CHART ANALYSIS
Level 3 Communications Insight
01/07/05 03:56:34 PMby Andrew Hetherington
This tradable looks like it should be watched closely.
Position: N/A
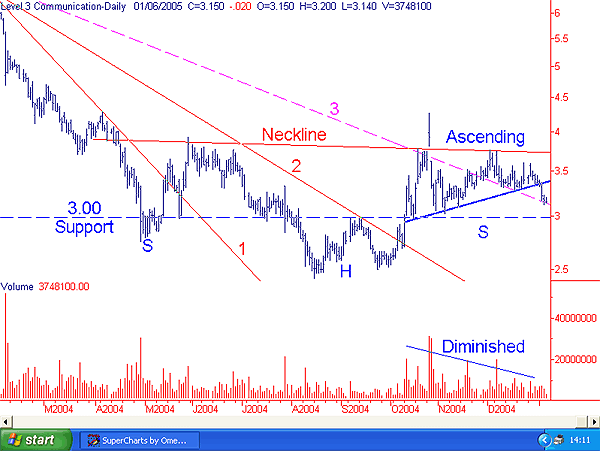
| On the daily chart (Figure 1), we have a large 10-month head and shoulders bottom reversal pattern. The volume on this pattern is near perfect, meaning it has high volume on the left shoulder on the way down. The dumping that has occurred on the way down has distributed most of the weak holders of this tradable. The very light volume at the base of the head illustrates that there are no more sellers at that price range in the $2.43 area. Then accumulation begins, evident with the much higher volume spikes on the forming of the second half of the head. This higher cumulative volume on the right side of the pattern is the key to unlock its medium- to long-term direction. |
| In the short term, however, it is weak. This is ideal for those interested in taking a long position with a medium- to long-term time horizon. It is best to buy a long position while the equity is weak. It may be best to watch the support in the $3.00 area, and when it breaks down below this support with high volume, this will be the correct time to take a long position. It won't likely reach the low of the head in the $2.43 area, so $2.60 to $2.80 is a good buy in point. |

|
| Figure 1: Level 3 Communications, daily. On this daily chart, we have a large 10-month head and shoulders bottom reversal pattern. |
| Graphic provided by: SuperCharts. |
| |
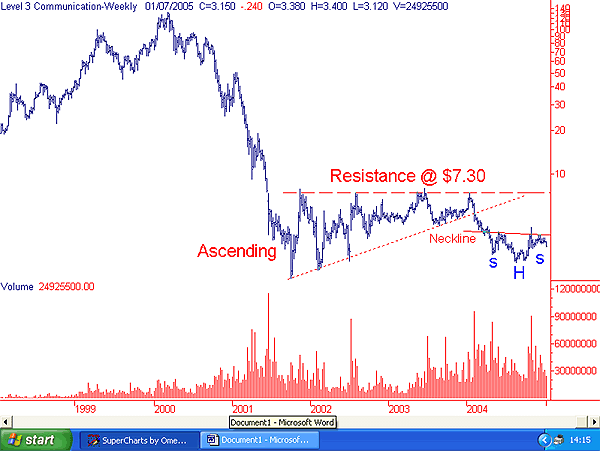
| Eventually, it will break to the top side of the neckline in the $3.70 area if our prognostication is correct, and the sell point will be where all the resistance is at the $7.30 area. This will take some time. |
| As with any position, if the general market trend remains long, then it is best to hang on until the equity breaks a support or runs up against a strong resistance. Do not think that the resistance in the $7.30 area will be overcome easily; it won't. This will be an appropriate resting point for this equity to gather steam once again. |
In Figure 2, the weekly chart has a large ascending triangle that broke on the downside, as did the small ascending triangle on the daily chart. Then there is the incomplete head and shoulders bottom reversal pattern, which should be watched.  Figure 2: Level 3 Communications, weekly |
Classic Dow Theorist who trades as a pure technician, using pattern recognition.
| Toronto, Canada |
Click here for more information about our publications!
Comments
Date: 01/08/05Rank: 5Comment:
Date: 01/11/05Rank: 3Comment:

Request Information From Our Sponsors
- StockCharts.com, Inc.
- Candle Patterns
- Candlestick Charting Explained
- Intermarket Technical Analysis
- John Murphy on Chart Analysis
- John Murphy's Chart Pattern Recognition
- John Murphy's Market Message
- MurphyExplainsMarketAnalysis-Intermarket Analysis
- MurphyExplainsMarketAnalysis-Visual Analysis
- StockCharts.com
- Technical Analysis of the Financial Markets
- The Visual Investor
- VectorVest, Inc.
- Executive Premier Workshop
- One-Day Options Course
- OptionsPro
- Retirement Income Workshop
- Sure-Fire Trading Systems (VectorVest, Inc.)
- Trading as a Business Workshop
- VectorVest 7 EOD
- VectorVest 7 RealTime/IntraDay
- VectorVest AutoTester
- VectorVest Educational Services
- VectorVest OnLine
- VectorVest Options Analyzer
- VectorVest ProGraphics v6.0
- VectorVest ProTrader 7
- VectorVest RealTime Derby Tool
- VectorVest Simulator
- VectorVest Variator
- VectorVest Watchdog
