HOT TOPICS LIST
- MACD
- Fibonacci
- RSI
- Gann
- ADXR
- Stochastics
- Volume
- Triangles
- Futures
- Cycles
- Volatility
- ZIGZAG
- MESA
- Retracement
- Aroon
INDICATORS LIST
LIST OF TOPICS
PRINT THIS ARTICLE
by Kevin Hopson
Despite signs of weakness, crude oil prices have rallied recently. Has the short-term downtrend reversed?
Position: Hold
Kevin Hopson
Kevin has been a technical analyst for roughly 10 years now. Previously, Kevin owned his own business and acted as a registered investment advisor, specializing in energy. He was also a freelance oil analyst for Orient Trading Co., a commodity futures trading firm in Japan. Kevin is currently a freelance writer.
PRINT THIS ARTICLE
TECHNICAL ANALYSIS
A Trend Change For Crude Oil?
01/07/05 08:08:40 AMby Kevin Hopson
Despite signs of weakness, crude oil prices have rallied recently. Has the short-term downtrend reversed?
Position: Hold
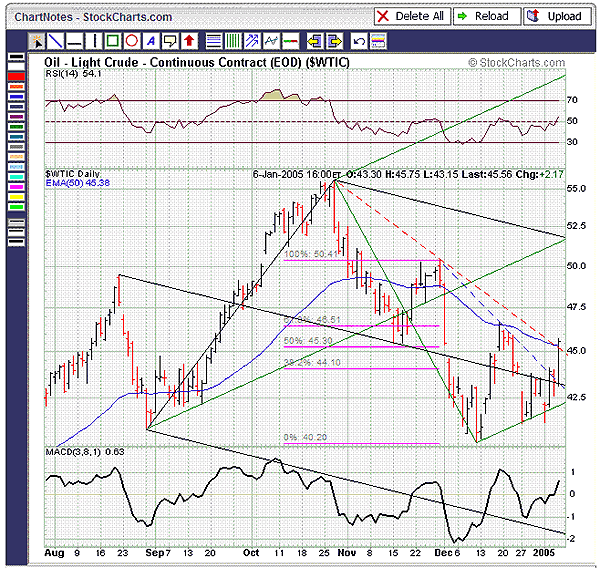
| Since October's high, crude oil has been in steep downtrend, as illustrated by the six-month chart. However, prices have moved higher recently, contrary to what the chart was telling us. For example, note how crude oil formed a symmetrical triangle off of the December lows. This triangle formed after a sharp move down in early December. Because symmetrical triangles tend to be continuation patterns, we would have expected another breakdown in prices. |
| In addition, note how prices failed to test the green median line before testing the bottom parallel line. This is known as the "price failure" rule, which is a sign of weakness in this example. As a result, a breach of December's uptrend line (bottom green parallel line) would have been the logical prediction. Surprisingly, this has failed to occur. However, just because the bottom parallel line has held thus far does not mean it will continue to do so. If prices test this uptrend line excessively, it could be a sign of further weakness. |

|
| Figure 1: Crude oil. Since October's high, crude oil has been in steep downtrend, as illustrated by this six-month chart. |
| Graphic provided by: StockCharts.com. |
| |
| In the meantime, things are looking up for crude oil. For example, see how prices recently breached November's downtrend line (dotted blue line), as well as the black median line. Moreover, crude oil has poked its head above October's downtrend line (dotted red line) and the 50-day moving average ($45.38). Though it is too early to tell whether the two-month downtrend has been broken, as further strength will be needed for confirmation, the indicators are pointing to higher prices. |
| More specifically, notice how the relative strength index (RSI) and moving average convergence/divergence (MACD) have moved above 50 and zero, respectively. What this means is that both of these indicators are now in positive territory, which creates the possibility of a followthrough rally. If this occurs, crude oil will likely confirm a short-term trend reversal. Not only that, prices could make their way up to the $46.50 level in the near term, which is the site of December's high and the 61.8% retracement from the November to December decline. |
Kevin has been a technical analyst for roughly 10 years now. Previously, Kevin owned his own business and acted as a registered investment advisor, specializing in energy. He was also a freelance oil analyst for Orient Trading Co., a commodity futures trading firm in Japan. Kevin is currently a freelance writer.
| Glen Allen, VA | |
| E-mail address: | hopson_1@yahoo.com |
Click here for more information about our publications!
Comments
Date: 01/08/05Rank: 3Comment:
Date: 01/10/05Rank: 3Comment:

Request Information From Our Sponsors
- StockCharts.com, Inc.
- Candle Patterns
- Candlestick Charting Explained
- Intermarket Technical Analysis
- John Murphy on Chart Analysis
- John Murphy's Chart Pattern Recognition
- John Murphy's Market Message
- MurphyExplainsMarketAnalysis-Intermarket Analysis
- MurphyExplainsMarketAnalysis-Visual Analysis
- StockCharts.com
- Technical Analysis of the Financial Markets
- The Visual Investor
- VectorVest, Inc.
- Executive Premier Workshop
- One-Day Options Course
- OptionsPro
- Retirement Income Workshop
- Sure-Fire Trading Systems (VectorVest, Inc.)
- Trading as a Business Workshop
- VectorVest 7 EOD
- VectorVest 7 RealTime/IntraDay
- VectorVest AutoTester
- VectorVest Educational Services
- VectorVest OnLine
- VectorVest Options Analyzer
- VectorVest ProGraphics v6.0
- VectorVest ProTrader 7
- VectorVest RealTime Derby Tool
- VectorVest Simulator
- VectorVest Variator
- VectorVest Watchdog
