HOT TOPICS LIST
- MACD
- Fibonacci
- RSI
- Gann
- ADXR
- Stochastics
- Volume
- Triangles
- Futures
- Cycles
- Volatility
- ZIGZAG
- MESA
- Retracement
- Aroon
INDICATORS LIST
LIST OF TOPICS
PRINT THIS ARTICLE
by David Penn
More than just a tool for top- and bottom-picking trends, the 2B test is one way for aggressive traders to trade sloppy, sideways markets.
Position: N/A
David Penn
Technical Writer for Technical Analysis of STOCKS & COMMODITIES magazine, Working-Money.com, and Traders.com Advantage.
PRINT THIS ARTICLE
REVERSAL
An Intraday 2B Test
01/07/05 03:49:34 PMby David Penn
More than just a tool for top- and bottom-picking trends, the 2B test is one way for aggressive traders to trade sloppy, sideways markets.
Position: N/A
| Is bottom-picking during a downtrend the same as bottom-picking during a sideways market? Many who scold traders and veer them away from attempting to pick tops and bottoms in markets neglect to answer this question. But for aggressive or otherwise highly active traders whose trading philosophy requires them to participate not only in clearly defined trends, but also in less-defined sideways markets, top- and bottom-picking may be a necessity from time to time. |
| There's really nothing wrong with that. Part of the reason why traders are discouraged from top- and bottom-picking is to prevent traders from trading against the often-overwhelming current of a true trend. However, in sideways markets, the trends that develop are generally far less powerful. As such, many of the trend-following methods that are popular during trends are often found to be lacking when markets move sideways. Breakouts and breakdowns fail, followthrough is weak or nonexistent, and market moves fall short of expected price targets. |

|
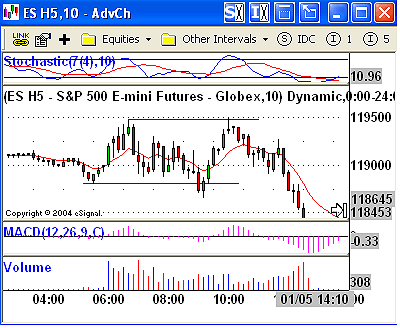
| Figure 1: S&P 500 emini. Although an effective tool for picking tops and bottoms in trending markets, the 2B test—as shown here—can be an even more effective tool for trading during range-bound markets. |
| Graphic provided by: eSignal. |
| |
| Intraday trading in the March emini Standard & Poor's 500 on Wednesday, January 5, provides an example of this problem--and suggests a remedy in the form of the 2B test. Trading on that day was characterized by sloppy, sideways, fairly conviction-free trading--at least until the final hour, when the market broke down into new lows. Traders trying to take advantage of moves above or below the 10-bar exponential moving average (EMA), for example, would have been disappointed for much of the day, as would those looking to game a breakout from the opening range. |
| What did prove successful, however, was the 2B test of the bottom. Note how prices midway through the 9:00 am hour created a new low on the day (specifically, the 9:30-9:40 am bar). However, there was no continuation or followthrough to the downside. Instead, the 9:40-9:50 am bar saw a relatively long lower shadow (or tail) and a reversal to the upside. When this was followed by another move to the upside in the form of the 9:50-10:00 am bar, savvy traders were on alert that a profitable trade to the long side was a distinct possibility. |
| From the high of the 9:50-10:00 am bar at 1190.50, the March S&P 500 emini (ESH5) rallied to 1195--and this without making a single, 10-minute lower low for the duration of the advance. Even a trailing-low stop on the 10-minute chart, for example, would have likely provided three-odd points per contract of gain. Not a bad turn of events for a trading day that appeared--in many respects--as barren of opportunity as this one did. |
Technical Writer for Technical Analysis of STOCKS & COMMODITIES magazine, Working-Money.com, and Traders.com Advantage.
| Title: | Technical Writer |
| Company: | Technical Analysis, Inc. |
| Address: | 4757 California Avenue SW |
| Seattle, WA 98116 | |
| Phone # for sales: | 206 938 0570 |
| Fax: | 206 938 1307 |
| Website: | www.Traders.com |
| E-mail address: | DPenn@traders.com |
Traders' Resource Links | |
| Charting the Stock Market: The Wyckoff Method -- Books | |
| Working-Money.com -- Online Trading Services | |
| Traders.com Advantage -- Online Trading Services | |
| Technical Analysis of Stocks & Commodities -- Publications and Newsletters | |
| Working Money, at Working-Money.com -- Publications and Newsletters | |
| Traders.com Advantage -- Publications and Newsletters | |
| Professional Traders Starter Kit -- Software | |
Click here for more information about our publications!
Comments
Date: 01/08/05Rank: 3Comment:
Date: 01/11/05Rank: 3Comment:

Request Information From Our Sponsors
- StockCharts.com, Inc.
- Candle Patterns
- Candlestick Charting Explained
- Intermarket Technical Analysis
- John Murphy on Chart Analysis
- John Murphy's Chart Pattern Recognition
- John Murphy's Market Message
- MurphyExplainsMarketAnalysis-Intermarket Analysis
- MurphyExplainsMarketAnalysis-Visual Analysis
- StockCharts.com
- Technical Analysis of the Financial Markets
- The Visual Investor
- VectorVest, Inc.
- Executive Premier Workshop
- One-Day Options Course
- OptionsPro
- Retirement Income Workshop
- Sure-Fire Trading Systems (VectorVest, Inc.)
- Trading as a Business Workshop
- VectorVest 7 EOD
- VectorVest 7 RealTime/IntraDay
- VectorVest AutoTester
- VectorVest Educational Services
- VectorVest OnLine
- VectorVest Options Analyzer
- VectorVest ProGraphics v6.0
- VectorVest ProTrader 7
- VectorVest RealTime Derby Tool
- VectorVest Simulator
- VectorVest Variator
- VectorVest Watchdog
