HOT TOPICS LIST
- MACD
- Fibonacci
- RSI
- Gann
- ADXR
- Stochastics
- Volume
- Triangles
- Futures
- Cycles
- Volatility
- ZIGZAG
- MESA
- Retracement
- Aroon
INDICATORS LIST
LIST OF TOPICS
PRINT THIS ARTICLE
by Arthur Hill
The flag breakout for the Dow diamonds remains the dominant signal, and the current pullback has reached its make-or-break point.
Position: Hold
Arthur Hill
Arthur Hill is currently editor of TDTrader.com, a website specializing in trading strategies, sector/industry specific breadth stats and overall technical analysis. He passed the Society of Technical Analysts (STA London) diploma exam with distinction is a Certified Financial Technician (CFTe). Prior to TD Trader, he was the Chief Technical Analyst for Stockcharts.com and the main contributor to the ChartSchool.
PRINT THIS ARTICLE
FLAGS AND PENNANTS
A Breakout, And Now A Test For The Dow Diamonds
01/06/05 03:18:42 PMby Arthur Hill
The flag breakout for the Dow diamonds remains the dominant signal, and the current pullback has reached its make-or-break point.
Position: Hold
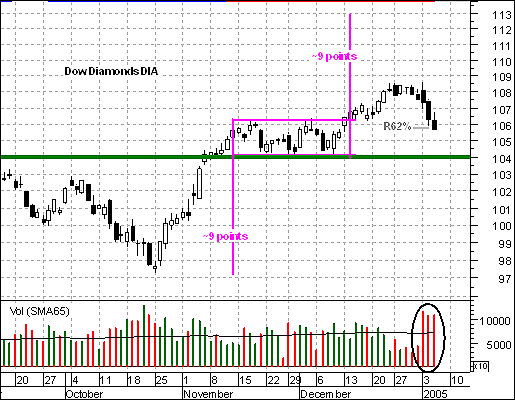
| In a Traders.com article on December 21, I focused on the flag breakout and a potential negative divergence in the relative strength index (RSI). The Dow diamonds (DIA) held the breakout and continued above 108, while RSI moved back above 70. This breakout is still bullish, but the depth and volume behind the recent pullback are cause for concern. |
| A basic tenet of technical analysis is that broken resistance turns into support. As such, broken flag resistance just above 106 becomes the first line of defense. The stock actually moved below 106 on December 5. A strong security should be able to hold its breakout, and the move back below is a concern. |

|
| Figure 1: Dow diamonds. The depth and volume behind the recent pullback are cause for concern. |
| Graphic provided by: MetaStock. |
| Graphic provided by: Reuters Data. |
| |
| In addition to broken resistance, a Fibonacci 62% retracement of the December advance marks support just below 106. Securities rarely move in a straight line, instead tending to zigzag higher. In an uptrend, a normal pullback or correction is 38-62% of the prior move. I would therefore expect a strong security to hold around its 62% retracement, which marks the extreme. |
| High volume shows a serious increase in selling pressure. While a return to broken resistance and a 62% retracement are normal for corrections, high volume is not. A decline should occur on low volume to signal weak selling pressure and volume should then expand on the resumption higher. This high volume decline raises the caution flag. Further weakness below broken resistance and past the 62% retracement mark would be enough to negate the breakout and consider more bearish possibilities. |
Arthur Hill is currently editor of TDTrader.com, a website specializing in trading strategies, sector/industry specific breadth stats and overall technical analysis. He passed the Society of Technical Analysts (STA London) diploma exam with distinction is a Certified Financial Technician (CFTe). Prior to TD Trader, he was the Chief Technical Analyst for Stockcharts.com and the main contributor to the ChartSchool.
| Title: | Editor |
| Company: | TDTrader.com |
| Address: | Willem Geetsstraat 17 |
| Mechelen, B2800 | |
| Phone # for sales: | 3215345465 |
| Website: | www.tdtrader.com |
| E-mail address: | arthurh@tdtrader.com |
Traders' Resource Links | |
| TDTrader.com has not added any product or service information to TRADERS' RESOURCE. | |
Click here for more information about our publications!
Comments
Date: 01/06/05Rank: 5Comment:
Date: 01/06/05Rank: 4Comment:
Date: 01/11/05Rank: 4Comment:

Request Information From Our Sponsors
- StockCharts.com, Inc.
- Candle Patterns
- Candlestick Charting Explained
- Intermarket Technical Analysis
- John Murphy on Chart Analysis
- John Murphy's Chart Pattern Recognition
- John Murphy's Market Message
- MurphyExplainsMarketAnalysis-Intermarket Analysis
- MurphyExplainsMarketAnalysis-Visual Analysis
- StockCharts.com
- Technical Analysis of the Financial Markets
- The Visual Investor
- VectorVest, Inc.
- Executive Premier Workshop
- One-Day Options Course
- OptionsPro
- Retirement Income Workshop
- Sure-Fire Trading Systems (VectorVest, Inc.)
- Trading as a Business Workshop
- VectorVest 7 EOD
- VectorVest 7 RealTime/IntraDay
- VectorVest AutoTester
- VectorVest Educational Services
- VectorVest OnLine
- VectorVest Options Analyzer
- VectorVest ProGraphics v6.0
- VectorVest ProTrader 7
- VectorVest RealTime Derby Tool
- VectorVest Simulator
- VectorVest Variator
- VectorVest Watchdog
