HOT TOPICS LIST
- MACD
- Fibonacci
- RSI
- Gann
- ADXR
- Stochastics
- Volume
- Triangles
- Futures
- Cycles
- Volatility
- ZIGZAG
- MESA
- Retracement
- Aroon
INDICATORS LIST
LIST OF TOPICS
PRINT THIS ARTICLE
by David Penn
The British pound joins the euro's excursion into the world of symmetrical triangles--with interesting results.
Position: N/A
David Penn
Technical Writer for Technical Analysis of STOCKS & COMMODITIES magazine, Working-Money.com, and Traders.com Advantage.
PRINT THIS ARTICLE
TRIANGLES
Sterling's Symmetrical Triangle
01/06/05 03:23:44 PMby David Penn
The British pound joins the euro's excursion into the world of symmetrical triangles--with interesting results.
Position: N/A
| I've discussed triangles at length elsewhere (see my "Charting The Markets" in the February 2005 issue of STOCKS & COMMODITIES), noting in particular that while directional triangles such as ascending and descending triangles provide a strong indication of future price movement, it is often best with all triangles (ascending, descending, and symmetrical) to wait until you see the whites of their breakout before taking a shot. |
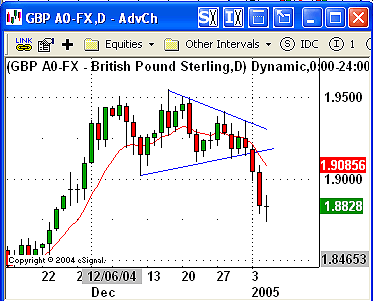
| It's been written that triangles that are part of topping formations often appear in the midst of head and shoulders tops. The symmetrical triangle in GBP/USD seems to be an example of this. The right shoulder of the head and shoulders top is a bit underdeveloped. But the price action clearly forms three distinct peaks, with a center peak that extends higher than the other two. Nevertheless, the symmetrical triangle--in which prices are bound by a pair of converging trendlines (as shown in Figure 1)--appears to me to be a more compelling technical "portrait" of GBP/USD. |

|
| Figure 1: The symmetrical triangle in the euro broke out to the upside--before collapsing. The symmetrical triangle in the pound, by contrast, made little pretense of sending sterling higher. |
| Graphic provided by: eSignal. |
| |
| Was there anything directional about the symmetrical triangle in GBP/USD? Arguably, the downtrending 10-day exponential moving average (in red) was one in which any upside breakout might be swimming against the current. Failing that, however, the only real signal that the pound was heading lower in the near term was the break below the lower trendline boundary of the triangle on January 3. That said, a trader who waited for that clear break would have been well rewarded over the next 24 hours. Closing at 1.9042 on the third, GBP/USD opened at 1.9040 the following day and proceeded to fall to a low of 1.8782 before bouncing somewhat to a close of 1.8833. Open to close, that's a move of more than 200 pips in one day. |
| How much downside did this triangle anticipate? The intraday price extremes (the first two touches of the triangle in the first half of December) creates a few complications in terms of determining the size of the triangle. But a reasonable measure suggests that the triangle is 534 pips wide at the most, though a more conservative measurement would make the triangle closer to 400 pips in width. |
| Subtracting the former amount from the value at the breakout (approximately 1.9150) gives a minimum downside projection of 1.8616. Using the latter provides a minimum downside of 1.8750. With GBP/USD nearing these levels on the third day after its breakout, traders should be on guard for a reaction--not unlike the post-breakdown reaction in the euro, when it broke free from its triangle. |
Technical Writer for Technical Analysis of STOCKS & COMMODITIES magazine, Working-Money.com, and Traders.com Advantage.
| Title: | Technical Writer |
| Company: | Technical Analysis, Inc. |
| Address: | 4757 California Avenue SW |
| Seattle, WA 98116 | |
| Phone # for sales: | 206 938 0570 |
| Fax: | 206 938 1307 |
| Website: | www.Traders.com |
| E-mail address: | DPenn@traders.com |
Traders' Resource Links | |
| Charting the Stock Market: The Wyckoff Method -- Books | |
| Working-Money.com -- Online Trading Services | |
| Traders.com Advantage -- Online Trading Services | |
| Technical Analysis of Stocks & Commodities -- Publications and Newsletters | |
| Working Money, at Working-Money.com -- Publications and Newsletters | |
| Traders.com Advantage -- Publications and Newsletters | |
| Professional Traders Starter Kit -- Software | |
Click here for more information about our publications!
Comments
Date: 01/06/05Rank: 3Comment:

Request Information From Our Sponsors
- StockCharts.com, Inc.
- Candle Patterns
- Candlestick Charting Explained
- Intermarket Technical Analysis
- John Murphy on Chart Analysis
- John Murphy's Chart Pattern Recognition
- John Murphy's Market Message
- MurphyExplainsMarketAnalysis-Intermarket Analysis
- MurphyExplainsMarketAnalysis-Visual Analysis
- StockCharts.com
- Technical Analysis of the Financial Markets
- The Visual Investor
- VectorVest, Inc.
- Executive Premier Workshop
- One-Day Options Course
- OptionsPro
- Retirement Income Workshop
- Sure-Fire Trading Systems (VectorVest, Inc.)
- Trading as a Business Workshop
- VectorVest 7 EOD
- VectorVest 7 RealTime/IntraDay
- VectorVest AutoTester
- VectorVest Educational Services
- VectorVest OnLine
- VectorVest Options Analyzer
- VectorVest ProGraphics v6.0
- VectorVest ProTrader 7
- VectorVest RealTime Derby Tool
- VectorVest Simulator
- VectorVest Variator
- VectorVest Watchdog
