HOT TOPICS LIST
- MACD
- Fibonacci
- RSI
- Gann
- ADXR
- Stochastics
- Volume
- Triangles
- Futures
- Cycles
- Volatility
- ZIGZAG
- MESA
- Retracement
- Aroon
INDICATORS LIST
LIST OF TOPICS
PRINT THIS ARTICLE
by David Penn
Does weakness in the stocks anticipate weakness in the metal?
Position: N/A
David Penn
Technical Writer for Technical Analysis of STOCKS & COMMODITIES magazine, Working-Money.com, and Traders.com Advantage.
PRINT THIS ARTICLE
HEAD & SHOULDERS
Newmont's Head And Shoulders Top
01/05/05 08:09:04 AMby David Penn
Does weakness in the stocks anticipate weakness in the metal?
Position: N/A
| On a day when gold takes another sharp move to the downside, it is worth remembering that while the yellow metal appears to have topped out in early December, gold stocks had been warning of weakness for some time. Newmont Mining (NEM), for example, appears to have topped out fully a month before gold did. If these stocks have further to fall, does that mean that the yellow metal around which they revolve will suffer further declines as well? |
| Intermarket technical analysis suggests, at a minimum, that commodities and the stocks of companies that trade in those commodities will tend to move together. What this means is that when there are divergences between commodities and commodity stocks, investors and trades should be on guard. In the words of legendary trader George Soros, such a situation means that there is a trend whos underlying premise is false. The trick, of course, is to determine which one. |

|
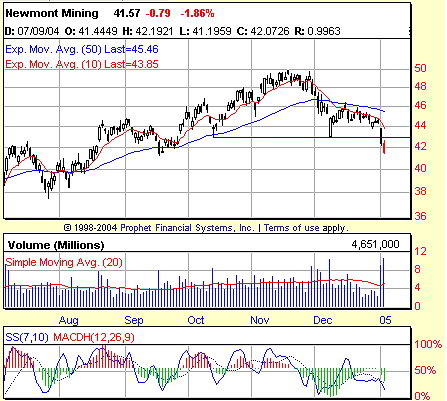
| Figure 1: Newmont Mining. Note the MACDH extreme in early December. These kind of extreme lows in the MACDH often anticipate major declines--such as may result from a 7-point head and shoulders top. |
| Graphic provided by: Prophet Financial, Inc. |
| |
| There appears to be little false about the head and shoulders top in NEM. The pattern is formed with a left shoulder in late September/early October trading, a head from early October to early December, and a right shoulder from early December to the end of the month. The neckline of the formation is at approximately 43, and the overwhelming volume that accompanied that penetration of this neckline in recent days only serves to underscore the bearishness of the head and shoulders top. |
| What does this head and shoulders top suggest about NEM's near-term movement? Measured from its highest point in mid-December to its neckline, this head and shoulders top is approximately 7 points, which, when projected downward from the neckline, suggests a minimum downside of 36--a minimum 13% decline from most recent levels. |
| And if this is bad news for Newmont Mining, is it similar bad news for gold in general? Gold dropped below its 10-day exponential moving average (EMA) early in December and in the past few days has fallen below its 50-day EMA as well. Neither development is bullish, to put it mildly--though there is support for February gold at the $420 level. Nevertheless, the same sort of major moving average convergence/divergence histogram (MACDH) trough that developed in Newmont Mining as its head and shoulders top was nearing completion has also appeared in gold. It is hard to believe that this MACDH trough won't have similar ramifications for the yellow metal as it appears to have for Newmont Mining. |
Technical Writer for Technical Analysis of STOCKS & COMMODITIES magazine, Working-Money.com, and Traders.com Advantage.
| Title: | Technical Writer |
| Company: | Technical Analysis, Inc. |
| Address: | 4757 California Avenue SW |
| Seattle, WA 98116 | |
| Phone # for sales: | 206 938 0570 |
| Fax: | 206 938 1307 |
| Website: | www.Traders.com |
| E-mail address: | DPenn@traders.com |
Traders' Resource Links | |
| Charting the Stock Market: The Wyckoff Method -- Books | |
| Working-Money.com -- Online Trading Services | |
| Traders.com Advantage -- Online Trading Services | |
| Technical Analysis of Stocks & Commodities -- Publications and Newsletters | |
| Working Money, at Working-Money.com -- Publications and Newsletters | |
| Traders.com Advantage -- Publications and Newsletters | |
| Professional Traders Starter Kit -- Software | |
Click here for more information about our publications!
Comments
Date: 01/05/05Rank: 4Comment:
Date: 01/10/05Rank: 5Comment:

Request Information From Our Sponsors
- StockCharts.com, Inc.
- Candle Patterns
- Candlestick Charting Explained
- Intermarket Technical Analysis
- John Murphy on Chart Analysis
- John Murphy's Chart Pattern Recognition
- John Murphy's Market Message
- MurphyExplainsMarketAnalysis-Intermarket Analysis
- MurphyExplainsMarketAnalysis-Visual Analysis
- StockCharts.com
- Technical Analysis of the Financial Markets
- The Visual Investor
- VectorVest, Inc.
- Executive Premier Workshop
- One-Day Options Course
- OptionsPro
- Retirement Income Workshop
- Sure-Fire Trading Systems (VectorVest, Inc.)
- Trading as a Business Workshop
- VectorVest 7 EOD
- VectorVest 7 RealTime/IntraDay
- VectorVest AutoTester
- VectorVest Educational Services
- VectorVest OnLine
- VectorVest Options Analyzer
- VectorVest ProGraphics v6.0
- VectorVest ProTrader 7
- VectorVest RealTime Derby Tool
- VectorVest Simulator
- VectorVest Variator
- VectorVest Watchdog
