HOT TOPICS LIST
- MACD
- Fibonacci
- RSI
- Gann
- ADXR
- Stochastics
- Volume
- Triangles
- Futures
- Cycles
- Volatility
- ZIGZAG
- MESA
- Retracement
- Aroon
INDICATORS LIST
LIST OF TOPICS
PRINT THIS ARTICLE
by David Penn
Trading setups and patterns can work together to spot and manage winning trades.
Position: N/A
David Penn
Technical Writer for Technical Analysis of STOCKS & COMMODITIES magazine, Working-Money.com, and Traders.com Advantage.
PRINT THIS ARTICLE
SYMMETRICAL TRIANGLE
The Euro's December Symmetrical Triangle
01/03/05 02:02:26 PMby David Penn
Trading setups and patterns can work together to spot and manage winning trades.
Position: N/A
| If truth be told, I discovered this symmetrical triangle after I had spotted the trading setup. The setup was a 2/10 long, the basic mechanics of which I discussed in a recent Traders.com Advantage article ("A Simple Short-Term Entry Strategy," December 21, 2004). To briefly recap, the 2/10 entry looks for two bars that have broken free from a trending 10-bar exponential moving average (EMA). |
| Derived from a method suggested by swing trader and author David Landry, and combined with the reverence Market Wizard Marty Schwartz held for the 10-bar EMA, this setup is a simple, straightforward way for traders to capitalize on trending markets--often quite early in the trend. Any variety of exits can be used; I have been working this setup with a simple trailing low for longer-term objectives (that is, daily). Intraday, for example, with the 10-minute e-mini S&P, I prefer a specific, gain-based objective (that is, two points). In any event, consider the application of the 2/10 setup in Figure 1 of the EUR/USD. |

|
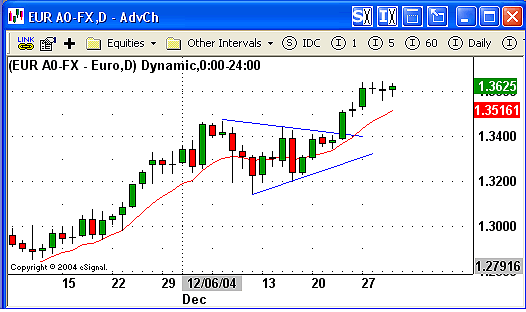
| Figure 1: Euro. The 2/10 long (12/21, 12/22) is filled on 12/23, the same day that the EUR/USD breaks free from the symmetrical triangle. Stopped out by a trailing lows stop at 1.3587 on 12/29, the 2/10 trader knows that the triangle nevertheless projects a minimum upside of 1.3736. |
| Graphic provided by: eSignal. |
| |
| Note how, after trading on the 10-day EMA for nine days during EUR/USD's early to mid-December consolidation, price bars begin to break free from the moving average. Once there are two days that are "free" from the uptrending 10-day EMA (specifically, December 21 and December 22), the 2/10 long trade becomes viable. The highest point of the pair is 1.3410 and the range of the pair is approximately 65 pips. Dividing that range in half (and rounding up) and adding that amount to the value at the high of the pair provides for a long entry target of 1.3443. The day after the pair, December 23, this entry target is hit and the long position is on. |
| That is what I spotted a few days ago. Shortly after noticing that 2/10 long, I realized that the entry day on December 23 is also the breakout day from a symmetrical triangle that bounds the early to mid-December consolidation. While volume is not a particularly helpful tool when analyzing foreign exchange trading, the relatively wide bar on the breakout is a pretty good indication that the breakout from the triangle was valid. What sort of upside did the symmetrical triangle project? The symmetrical triangle began on December 7 with a high of 1.3469 and made its pattern low on December 10 at 1.3141. This formation size of 328 pips is added to the value at the breakout on December 23 (approximately 1.3408) and gives a projected minimum upside of 1.3736. |
| This minimum upside is some 100-odd pips away from most recent levels shown in Figure 1. Using an exit strategy of trailing lows, a 2/10 long trader from December 23 would have been stopped out on December 29 near 1.3590-1.3587--after a solid gain of something in the area of 144 pips. If the projection of the triangle's breakout is valid, however, there is still significant upside to be had. |
Technical Writer for Technical Analysis of STOCKS & COMMODITIES magazine, Working-Money.com, and Traders.com Advantage.
| Title: | Technical Writer |
| Company: | Technical Analysis, Inc. |
| Address: | 4757 California Avenue SW |
| Seattle, WA 98116 | |
| Phone # for sales: | 206 938 0570 |
| Fax: | 206 938 1307 |
| Website: | www.Traders.com |
| E-mail address: | DPenn@traders.com |
Traders' Resource Links | |
| Charting the Stock Market: The Wyckoff Method -- Books | |
| Working-Money.com -- Online Trading Services | |
| Traders.com Advantage -- Online Trading Services | |
| Technical Analysis of Stocks & Commodities -- Publications and Newsletters | |
| Working Money, at Working-Money.com -- Publications and Newsletters | |
| Traders.com Advantage -- Publications and Newsletters | |
| Professional Traders Starter Kit -- Software | |
Click here for more information about our publications!
Comments
Date: 01/04/05Rank: 3Comment:

|

Request Information From Our Sponsors
- VectorVest, Inc.
- Executive Premier Workshop
- One-Day Options Course
- OptionsPro
- Retirement Income Workshop
- Sure-Fire Trading Systems (VectorVest, Inc.)
- Trading as a Business Workshop
- VectorVest 7 EOD
- VectorVest 7 RealTime/IntraDay
- VectorVest AutoTester
- VectorVest Educational Services
- VectorVest OnLine
- VectorVest Options Analyzer
- VectorVest ProGraphics v6.0
- VectorVest ProTrader 7
- VectorVest RealTime Derby Tool
- VectorVest Simulator
- VectorVest Variator
- VectorVest Watchdog
- StockCharts.com, Inc.
- Candle Patterns
- Candlestick Charting Explained
- Intermarket Technical Analysis
- John Murphy on Chart Analysis
- John Murphy's Chart Pattern Recognition
- John Murphy's Market Message
- MurphyExplainsMarketAnalysis-Intermarket Analysis
- MurphyExplainsMarketAnalysis-Visual Analysis
- StockCharts.com
- Technical Analysis of the Financial Markets
- The Visual Investor
