HOT TOPICS LIST
- MACD
- Fibonacci
- RSI
- Gann
- ADXR
- Stochastics
- Volume
- Triangles
- Futures
- Cycles
- Volatility
- ZIGZAG
- MESA
- Retracement
- Aroon
INDICATORS LIST
LIST OF TOPICS
PRINT THIS ARTICLE
by Gary Grosschadl
Synopsys, a world leader in semiconductor design software, technically looks strong for a continued bounce.
Position: Buy
Gary Grosschadl
Independent Canadian equities trader and technical analyst based in Peterborough
Ontario, Canada.
PRINT THIS ARTICLE
ANDREWS PITCH-FORK
Synopsys Pushing Higher
12/29/04 08:00:45 AMby Gary Grosschadl
Synopsys, a world leader in semiconductor design software, technically looks strong for a continued bounce.
Position: Buy
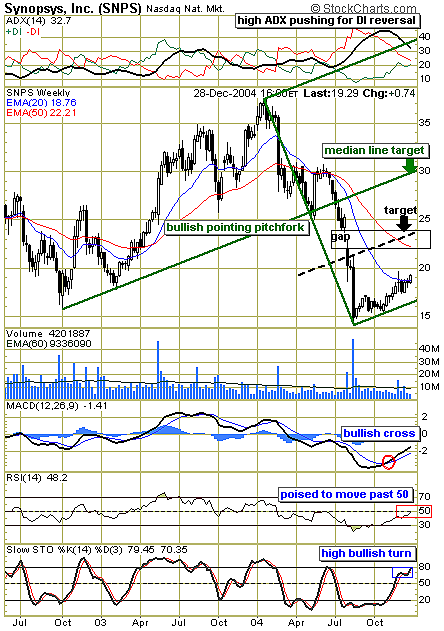
| Synopsys, Inc., was punished hard this year, falling from $37 to $15. Since finding support at $15, the stock is thrusting past its 20-week exponential moving average (EMA) and now deserves a closer look. The move above this moving average should add some bullish fire to this drive. |
| An Andrews pitchfork is drawn using three turning points in order to see where this move may carry. Pitchfork theory holds that 80% of the time, a valid pitchfork will eventually move to its median line. This presents an ambitious target of $30-plus. Since this is a rather large pitchfork, a smaller move to a midpoint line would make for a more prudent target in view of two other factors. This area also represents a previous gap and the current 50-period EMA of 22.21. Previous gaps often become significant points of future support/resistance. This target area of $22 to $24 makes a good trading target for those reasons. |

|
| Figure 1: Synopsys. Weekly chart shows two targets using pitchfork analysis. Since finding support at $15, the stock is thrusting past its 20-week EMA and now deserves a closer look. |
| Graphic provided by: StockCharts.com. |
| |
| Several indicators also support a bullish view. The directional movement indicator (at the top of Figure 1) shows a trend change in the making as the average directional movement index (ADX) is coming off a peak, while the directional index (DI) components converge to a possible cross. When +DI rises above -DI, the bulls are firmly back in charge, and then a rising ADX (once it reverses) adds bullish trend strength to the move, should this transpire. |
| The lower indicators also show bullish developments. The moving average convergence/divergence (MACD) has made a bullish crossover from low levels, while the relative strength index (RSI) promises to rise past the key area of 50. The stochastic indicator has recently done a "high turn," which often leads to a continued bullish push north. |
| Although a move to the gap area is anticipated, a surprise move that violates the lowest pitchfork line (lower median line) would be very bearish and invalidate the bullish pitchfork. |
Independent Canadian equities trader and technical analyst based in Peterborough
Ontario, Canada.
| Website: | www.whatsonsale.ca/financial.html |
| E-mail address: | gwg7@sympatico.ca |
Click here for more information about our publications!
Comments
Date: 12/29/04Rank: 5Comment:

Request Information From Our Sponsors
- StockCharts.com, Inc.
- Candle Patterns
- Candlestick Charting Explained
- Intermarket Technical Analysis
- John Murphy on Chart Analysis
- John Murphy's Chart Pattern Recognition
- John Murphy's Market Message
- MurphyExplainsMarketAnalysis-Intermarket Analysis
- MurphyExplainsMarketAnalysis-Visual Analysis
- StockCharts.com
- Technical Analysis of the Financial Markets
- The Visual Investor
- VectorVest, Inc.
- Executive Premier Workshop
- One-Day Options Course
- OptionsPro
- Retirement Income Workshop
- Sure-Fire Trading Systems (VectorVest, Inc.)
- Trading as a Business Workshop
- VectorVest 7 EOD
- VectorVest 7 RealTime/IntraDay
- VectorVest AutoTester
- VectorVest Educational Services
- VectorVest OnLine
- VectorVest Options Analyzer
- VectorVest ProGraphics v6.0
- VectorVest ProTrader 7
- VectorVest RealTime Derby Tool
- VectorVest Simulator
- VectorVest Variator
- VectorVest Watchdog
