HOT TOPICS LIST
- MACD
- Fibonacci
- RSI
- Gann
- ADXR
- Stochastics
- Volume
- Triangles
- Futures
- Cycles
- Volatility
- ZIGZAG
- MESA
- Retracement
- Aroon
INDICATORS LIST
LIST OF TOPICS
PRINT THIS ARTICLE
by Gary Grosschadl
The Santa Claus rally has been true to its namesake. Stocks have climbed in the period between Christmas and the New Year. But what happens next?
Position: Hold
Gary Grosschadl
Independent Canadian equities trader and technical analyst based in Peterborough
Ontario, Canada.
PRINT THIS ARTICLE
CHART ANALYSIS
Anticipating A Short-Term Correction
12/28/04 01:44:14 PMby Gary Grosschadl
The Santa Claus rally has been true to its namesake. Stocks have climbed in the period between Christmas and the New Year. But what happens next?
Position: Hold
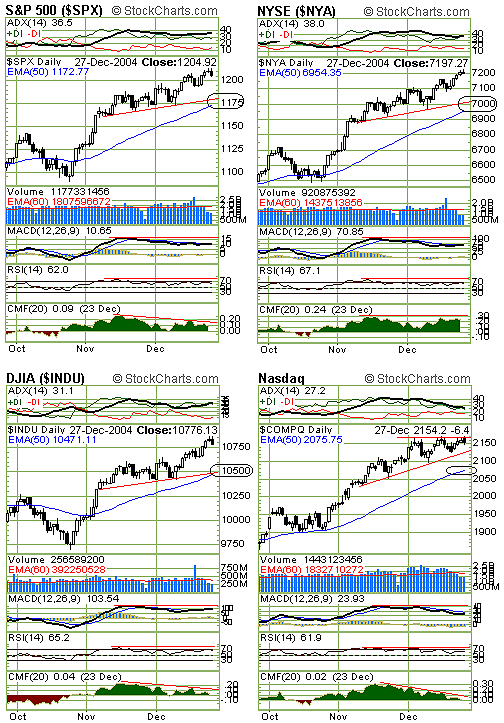
| Will it be the Grinch who stole the Christmas rally, or will it be another bullish phenomena called the January effect? A look at the charts for the major indexes (Standard & Poor's 500, NYA, Dow Jones Industrial Average, Nasdaq) leads me to believe that the "grinch" may erase the rally just enjoyed by the Xmas bulls. |
| I am currently bullish on the long-term markets concerning monthly charts and bullish on the medium term concerning weekly charts. However, I have bearish concerns on the daily charts, so in the short term I anticipate a move down to test a support level at or near the 50-day exponential moving average (EMA). I base this on a favored set of technical parameters--namely, multiple divergences. In this case, multiple negative convergences. |

|
| Figure 1: Daily charts for the major indexes may be susceptible to succumbing to multiple negative divergences. |
| Graphic provided by: StockCharts.com. |
| |
| The strongest rises and falls in the market are most times acknowledged by common trusted technical indicators that move in the same direction. The simplest example would be volume. Trends are stongest when volume confirms them in either direction. Other indicators many traders track include average directional movement index (ADX), moving average convergence/divergence (MACD), relative strength index (RSI) and Chaikin money flow (CMF). |
| The four charts all show the same bearish development--multiple negative divergences. I have chosen not to include trading volumes, as the holidays usually have lighter volumes. As these markets have enjoyed a general rising trend from mid-November, the displayed indicators have not joined the party. They have remained flat or actually trended down, as in the case of most of the MACDs and CMFs. This brings the latest rise in considerable question as to whether it is sustainable, at least in the short term. |
| The most logical support if a downleg soon develops would be a move to short-term trendlines and/or the 50-day EMA. In the case of the Dow Jones Industrial Average, this could entail a corrective move down some 300 points to its 50-day EMA, currently 10,471. Should this move occur, short-term traders could benefit from attempting to time the market (one of the hardest things to do) by taking profits now and then reloading at lower levels -- that is, a bounce off lower support. Medium-term and long-term traders would hold their positions until proven wrong on the weekly or monthly charts, as a bounce off the 50-day EMA on the daily chart would be seen as a normal and healthy retracement. A subsequent rise back up could lead to the often hoped-for January effect (stocks rising as investors buy back stocks after tax-loss selling). |
Independent Canadian equities trader and technical analyst based in Peterborough
Ontario, Canada.
| Website: | www.whatsonsale.ca/financial.html |
| E-mail address: | gwg7@sympatico.ca |
Click here for more information about our publications!
Comments
Date: 12/28/04Rank: 4Comment:
Date: 12/30/04Rank: 4Comment:
Date: 01/05/05Rank: 3Comment:

|

Request Information From Our Sponsors
- StockCharts.com, Inc.
- Candle Patterns
- Candlestick Charting Explained
- Intermarket Technical Analysis
- John Murphy on Chart Analysis
- John Murphy's Chart Pattern Recognition
- John Murphy's Market Message
- MurphyExplainsMarketAnalysis-Intermarket Analysis
- MurphyExplainsMarketAnalysis-Visual Analysis
- StockCharts.com
- Technical Analysis of the Financial Markets
- The Visual Investor
- VectorVest, Inc.
- Executive Premier Workshop
- One-Day Options Course
- OptionsPro
- Retirement Income Workshop
- Sure-Fire Trading Systems (VectorVest, Inc.)
- Trading as a Business Workshop
- VectorVest 7 EOD
- VectorVest 7 RealTime/IntraDay
- VectorVest AutoTester
- VectorVest Educational Services
- VectorVest OnLine
- VectorVest Options Analyzer
- VectorVest ProGraphics v6.0
- VectorVest ProTrader 7
- VectorVest RealTime Derby Tool
- VectorVest Simulator
- VectorVest Variator
- VectorVest Watchdog
