HOT TOPICS LIST
- MACD
- Fibonacci
- RSI
- Gann
- ADXR
- Stochastics
- Volume
- Triangles
- Futures
- Cycles
- Volatility
- ZIGZAG
- MESA
- Retracement
- Aroon
INDICATORS LIST
LIST OF TOPICS
PRINT THIS ARTICLE
by Koos van der Merwe
Statistics show that since 1885, the market has never been bearish in a year ending in a '5' -- but there is always a first. What does a chart of the Dow tell us?
Position: N/A
Koos van der Merwe
Has been a technical analyst since 1969, and has worked as a futures and options trader with First Financial Futures in Johannesburg, South Africa.
PRINT THIS ARTICLE
ELLIOTT WAVE
How High The Dow?
12/28/04 08:27:45 AMby Koos van der Merwe
Statistics show that since 1885, the market has never been bearish in a year ending in a '5' -- but there is always a first. What does a chart of the Dow tell us?
Position: N/A
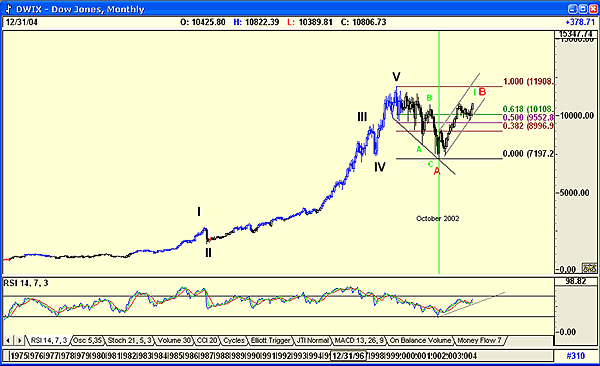
| Post-US Presidential election years since 1900 shows that the market usually falls from mid-January into the end of February before rising again to finish the year on a positive note, but with below-par results. Statistics show that since 1885, the market has never been bearish in a year ending in a '5,' so this could mean that 2005 could be a flat year, but not negative. However, there is always a first. What does a chart of the Dow now tell us? Figure 1 is a monthly chart of the Dow that shows my preferred wave count, namely that the Dow is now in a B-wave moving upward. The relative strength index (RSI), which has not reached overbought levels, suggests that the trend is truly upward, with still a long way to go. |
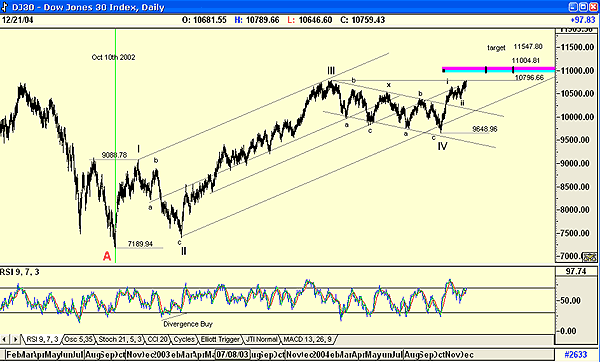
| In past articles I have stressed that an Elliottician should always have an alternate count in mind and should be ready to present it as soon as it proves itself to be prime. This may be the case at the moment, and Figure 2, a daily chart of the Dow, presents a convincing argument. |

|
| Figure 1: Dow Jones Industrial Average, monthly wave chart. This figure shows Singer's preferred wave count, namely that the Dow is now in a B-wave moving upward. The relative strength index (RSI), which has not reached overbought levels, suggests that the trend is truly upward, with still a long way to go. |
| Graphic provided by: AdvancedGET. |
| |
The daily chart highlights the problem. B-waves always follow an "abc-abc" OR "abc-x-abc" pattern. In my years as a chartist and Elliottician, I have seen an "a,b,(i,ii,iii,iv,v) c" pattern culminating the B-wave and falling into a C-wave down, which turned out to be less dramatic than usual. For a B-wave up to follow a five-wave impulse pattern upward is unusual and suggests that the primary count could be faulty. With the Dow in a strong Xmas rally and post-Presidential year analysis suggesting a rise into January 2005, I must therefore look for a fifth-wave target for the Dow, three of which present themselves. Figure 2: Dow Jones Industrial Average, daily chart. For a B-wave up to follow a five-wave impulse pattern upward is unusual and suggests that the primary count could be faulty. |
| 1. The first target is 10796.66, the resistance level of the high of wave III. Should the Dow not penetrate this level decisively, then the original count as shown in Figure 1 would change to the following. Wave I would become 'A.' Wave II would be 'B' and wave III would be 'C,' completing wave B upward. Wave IV would then be wave I down of wave C, and the Dow would now be completing wave II of wave C. Wave III of wave C would then be a dramatic fall. 2. The second target is 11004.81. This is derived by the make or break indicator (MOB) of the Advanced GET software. The MOB study is an excellent tool that helps us find the target price area for the end of an Elliott wave 5, or for any pattern that has an impulse-correction-impulse pattern. This target could be a wave 1 of a new five-impulse wave upward. 3. The third target of 11547.80 is an Elliott wave calculation. Wave theory says that wave 5 is equal or greater than wave 1. By assuming that wave 5 will be equal to wave 1, we obtain the target of 11547.80 (9088.78 - 7189.94 = 1898.84 + 9648.96 = 11547.80). This could then be wave 1 of a new impulse five-wave upward. (I have shown this in green on Figure 1.) The fact that all the major Fibonacci retracement levels have been penetrated supports the bullish arguments of nos. 2 and 3 above. |
| Of course, the bee in the bonnet is the RSI , which could fall into a divergence sell signal. This would strengthen the theory I suggested in no. 1 above. With the year-end approaching, and the Dow Jones Industrial Average very bullish into a Xmas rally, we should be prepared for anything. Volume will drop in the days between Xmas and the New Year as players take a breather with the festive season. Hopefully, 2005 will follow tradition and be a very bullish year, and the Dow should then target nos. 2 or 3 above. This will complete wave I of a major three-wave impulse wave upward. Remember too that wave II of this impulse wave will be bearish, supporting the suggestion of a down move from mid-January to the end of February. The question is, how far will the fall of wave II be? Will it translate into a wave II of a five-wave impulse wave upward, or will it turn into a wave 1 of a wave C downwards? Past performances, as I mentioned at the beginning of this article, suggest the former. |
Has been a technical analyst since 1969, and has worked as a futures and options trader with First Financial Futures in Johannesburg, South Africa.
| Address: | 3256 West 24th Ave |
| Vancouver, BC | |
| Phone # for sales: | 6042634214 |
| E-mail address: | petroosp@gmail.com |
Click here for more information about our publications!
Comments
Date: 12/28/04Rank: 4Comment:
Date: 01/05/05Rank: 3Comment:

|

Request Information From Our Sponsors
- VectorVest, Inc.
- Executive Premier Workshop
- One-Day Options Course
- OptionsPro
- Retirement Income Workshop
- Sure-Fire Trading Systems (VectorVest, Inc.)
- Trading as a Business Workshop
- VectorVest 7 EOD
- VectorVest 7 RealTime/IntraDay
- VectorVest AutoTester
- VectorVest Educational Services
- VectorVest OnLine
- VectorVest Options Analyzer
- VectorVest ProGraphics v6.0
- VectorVest ProTrader 7
- VectorVest RealTime Derby Tool
- VectorVest Simulator
- VectorVest Variator
- VectorVest Watchdog
- StockCharts.com, Inc.
- Candle Patterns
- Candlestick Charting Explained
- Intermarket Technical Analysis
- John Murphy on Chart Analysis
- John Murphy's Chart Pattern Recognition
- John Murphy's Market Message
- MurphyExplainsMarketAnalysis-Intermarket Analysis
- MurphyExplainsMarketAnalysis-Visual Analysis
- StockCharts.com
- Technical Analysis of the Financial Markets
- The Visual Investor
