HOT TOPICS LIST
- MACD
- Fibonacci
- RSI
- Gann
- ADXR
- Stochastics
- Volume
- Triangles
- Futures
- Cycles
- Volatility
- ZIGZAG
- MESA
- Retracement
- Aroon
INDICATORS LIST
LIST OF TOPICS
PRINT THIS ARTICLE
by Arthur Hill
Despite a rally from late October to early December, Lexmark failed to break resistance, and key indicators point to weakness ahead.
Position: Sell
Arthur Hill
Arthur Hill is currently editor of TDTrader.com, a website specializing in trading strategies, sector/industry specific breadth stats and overall technical analysis. He passed the Society of Technical Analysts (STA London) diploma exam with distinction is a Certified Financial Technician (CFTe). Prior to TD Trader, he was the Chief Technical Analyst for Stockcharts.com and the main contributor to the ChartSchool.
PRINT THIS ARTICLE
REL. STR COMPARATIVE
Lexmark Shows Distribution Amid Weak Relative Strength
12/27/04 08:33:33 AMby Arthur Hill
Despite a rally from late October to early December, Lexmark failed to break resistance, and key indicators point to weakness ahead.
Position: Sell
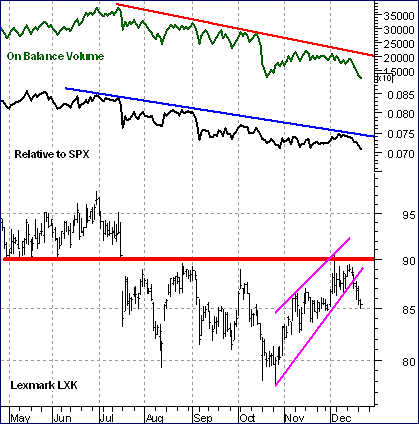
| Broken support turns into resistance. This tenet of technical analysis proved itself in August, October, and December. Lexmark (LXK) stock gapped below support at 90 in July, and this level turned into resistance that was confirmed at least three times. As long as 90 holds, the gap is unfilled and the bears hold a clear edge. |
| The price relative shows underperformance. The price relative is the ratio of LXK to the Standard & Poor's 500. The ratio rises when LXK outperforms the index and falls when LXK underperforms. The price relative has been trending lower since May and shows some serious underperformance. While the S&P 500 is trading at new 52-week highs, LXK remains below its 52-week high at 97.5. This is not a good sign and shows that LXK is out of favor relative to the S&P 500. |

|
| Figure 1: Lexmark. Broken support turns into resistance. LXK gapped below support at 90 in July, and this level turned into resistance that was confirmed at least three times. As long as 90 holds, the gap is unfilled and the bears hold a clear edge. |
| Graphic provided by: MetaStock. |
| Graphic provided by: Reuters Data. |
| |
| On-balance volume (OBV) shows distribution. This classic Granville indicator is a cumulative reading of daily volume. Volume is added on up days and subtracted on down days. OBV has been trending lower since July, and this shows more volume on down days than up days. Even though the stock has traded relatively flat, a declining OBV suggests more selling than buying and hence distribution. |
Arthur Hill is currently editor of TDTrader.com, a website specializing in trading strategies, sector/industry specific breadth stats and overall technical analysis. He passed the Society of Technical Analysts (STA London) diploma exam with distinction is a Certified Financial Technician (CFTe). Prior to TD Trader, he was the Chief Technical Analyst for Stockcharts.com and the main contributor to the ChartSchool.
| Title: | Editor |
| Company: | TDTrader.com |
| Address: | Willem Geetsstraat 17 |
| Mechelen, B2800 | |
| Phone # for sales: | 3215345465 |
| Website: | www.tdtrader.com |
| E-mail address: | arthurh@tdtrader.com |
Traders' Resource Links | |
| TDTrader.com has not added any product or service information to TRADERS' RESOURCE. | |
Click here for more information about our publications!
Comments
Date: 12/28/04Rank: 4Comment:

Request Information From Our Sponsors
- StockCharts.com, Inc.
- Candle Patterns
- Candlestick Charting Explained
- Intermarket Technical Analysis
- John Murphy on Chart Analysis
- John Murphy's Chart Pattern Recognition
- John Murphy's Market Message
- MurphyExplainsMarketAnalysis-Intermarket Analysis
- MurphyExplainsMarketAnalysis-Visual Analysis
- StockCharts.com
- Technical Analysis of the Financial Markets
- The Visual Investor
- VectorVest, Inc.
- Executive Premier Workshop
- One-Day Options Course
- OptionsPro
- Retirement Income Workshop
- Sure-Fire Trading Systems (VectorVest, Inc.)
- Trading as a Business Workshop
- VectorVest 7 EOD
- VectorVest 7 RealTime/IntraDay
- VectorVest AutoTester
- VectorVest Educational Services
- VectorVest OnLine
- VectorVest Options Analyzer
- VectorVest ProGraphics v6.0
- VectorVest ProTrader 7
- VectorVest RealTime Derby Tool
- VectorVest Simulator
- VectorVest Variator
- VectorVest Watchdog
