HOT TOPICS LIST
- MACD
- Fibonacci
- RSI
- Gann
- ADXR
- Stochastics
- Volume
- Triangles
- Futures
- Cycles
- Volatility
- ZIGZAG
- MESA
- Retracement
- Aroon
INDICATORS LIST
LIST OF TOPICS
PRINT THIS ARTICLE
by Kevin Hopson
A bullish consolidation pattern could lead to much higher prices for Tesoro Petroleum stock.
Position: Accumulate
Kevin Hopson
Kevin has been a technical analyst for roughly 10 years now. Previously, Kevin owned his own business and acted as a registered investment advisor, specializing in energy. He was also a freelance oil analyst for Orient Trading Co., a commodity futures trading firm in Japan. Kevin is currently a freelance writer.
PRINT THIS ARTICLE
TECHNICAL ANALYSIS
A Trading Range For Tesoro Petroleum
12/21/04 10:44:58 AMby Kevin Hopson
A bullish consolidation pattern could lead to much higher prices for Tesoro Petroleum stock.
Position: Accumulate
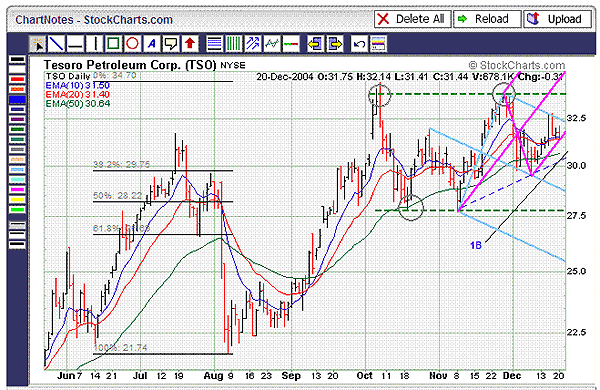
| Tesoro Petroleum (TSO) has been stuck in a trading range since early October, encountering resistance around $34.00, while finding support at the $28.00 level. It is no surprise that the $28.00 level has held on the downside, as this is the site of the 50% retracement from the August to October rally. Because trading ranges tend to be continuation patterns and the prior move was up, I believe Tesoro could break out again soon. If so, the stock could eventually make its way up to the $40.00 to $46.00 range. This assumes that prices will not test the bottom channel line again before breaking out. |
| I calculated this target by taking the number of times that prices have tested the top channel line in alternate sequence (2), multiplying this by the width of the trading range ($34.00-$28.00=$6.00) and then adding this figure ($6.00*2=$12.00) to the bottom ($28.00+$12.00=$40.00) and top ($34.00+$12.00=$46.00) channel lines. This means that Tesoro could have 25% to 45% of additional upside from here. See Figure 1. |

|
| Figure 1: Tesoro Petroleum. A bullish consolidation pattern could lead to much higher prices for Tesoro Petroleum stock. |
| Graphic provided by: StockCharts.com. |
| |
| In the meantime, the stock is coming to a short-term inflection point. For example, note how the bottom parallel line of the purple pitchfork has supported prices during this month's rally. This is also the site of the stock's 10-day and 20-day moving averages. However, the top parallel line of the blue pitchfork (November's downtrend line) has capped prices during this time. As a result, a small triangle has formed, meaning that a sizable move (up or down) is possible in the near term. |
| The fact that prices failed to test the purple median line before bouncing off the bottom parallel line (price failure rule) indicates short-term weakness. In other words, a break of this month's uptrend line would be the logical prediction. However, if this occurs, I would look at it as a buying opportunity given the longer-term bullish consolidation pattern. More specifically, the $30.50 to $30.70 range would be a good entry point. This is the site of the stock's 50-day moving average, November's uptrend line (dotted blue line), and the 1B channel line. On the other hand, if Tesoro can overcome downtrend resistance around $32.50, the stock could look to test the top channel line ($34.00) in the near term. Either way, I would look to accumulate shares of Tesoro Petroleum, as the risk/reward is favorable at current prices. |
Kevin has been a technical analyst for roughly 10 years now. Previously, Kevin owned his own business and acted as a registered investment advisor, specializing in energy. He was also a freelance oil analyst for Orient Trading Co., a commodity futures trading firm in Japan. Kevin is currently a freelance writer.
| Glen Allen, VA | |
| E-mail address: | hopson_1@yahoo.com |
Click here for more information about our publications!
Comments
Date: 12/28/04Rank: 3Comment:

Request Information From Our Sponsors
- StockCharts.com, Inc.
- Candle Patterns
- Candlestick Charting Explained
- Intermarket Technical Analysis
- John Murphy on Chart Analysis
- John Murphy's Chart Pattern Recognition
- John Murphy's Market Message
- MurphyExplainsMarketAnalysis-Intermarket Analysis
- MurphyExplainsMarketAnalysis-Visual Analysis
- StockCharts.com
- Technical Analysis of the Financial Markets
- The Visual Investor
- VectorVest, Inc.
- Executive Premier Workshop
- One-Day Options Course
- OptionsPro
- Retirement Income Workshop
- Sure-Fire Trading Systems (VectorVest, Inc.)
- Trading as a Business Workshop
- VectorVest 7 EOD
- VectorVest 7 RealTime/IntraDay
- VectorVest AutoTester
- VectorVest Educational Services
- VectorVest OnLine
- VectorVest Options Analyzer
- VectorVest ProGraphics v6.0
- VectorVest ProTrader 7
- VectorVest RealTime Derby Tool
- VectorVest Simulator
- VectorVest Variator
- VectorVest Watchdog
