

HOT TOPICS LIST
- MACD
- Fibonacci
- RSI
- Gann
- ADXR
- Stochastics
- Volume
- Triangles
- Futures
- Cycles
- Volatility
- ZIGZAG
- MESA
- Retracement
- Aroon
INDICATORS LIST
LIST OF TOPICS
PRINT THIS ARTICLE
by Gary Grosschadl
After rising more than $7 in five months, Disney stock looks vulnerable for a downside move.
Position: Sell
Gary Grosschadl
Independent Canadian equities trader and technical analyst based in Peterborough
Ontario, Canada.
PRINT THIS ARTICLE
CHART ANALYSIS
Walt Disney Warns Of A Top
12/21/04 01:37:19 PMby Gary Grosschadl
After rising more than $7 in five months, Disney stock looks vulnerable for a downside move.
Position: Sell
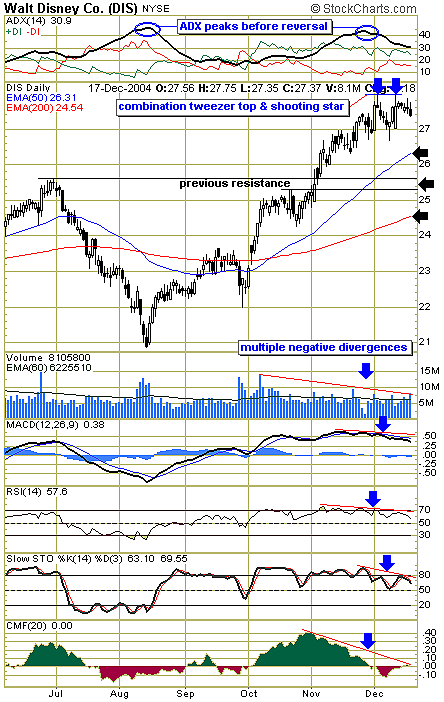
| Candlestick analysis hints that a downleg may be in store for this entertainment giant. The chart shows a combination of two potential topping patterns. Early in December, a shooting star candlestick emerged. This small-bodied candlestick has a long upper shadow, which can indicate a potential top after an upleg. Three down days followed, which was reversed by a hammer candlestick, leading to another run at the previous top. This equal top was also faded, giving a "tweezer" top. The tweezer comes in the form of a pincer-like appearance with two long upper shadows. Tweezers have significance at tops and bottoms and are characterized by equal highs or lows that may be back-to-back or separated by several trading sessions. They have extra significance when accompanied by another pattern, in this case a shooting star candlestick (another bearish pattern). |
| Several other indicators lend credence to this possible top warning. At the top of the chart (Figure 1), we see the average directional movement index (ADX) is coming off a peak. This typically leads or coincides with a trend change. Note how the previous peak move closely related to the reversal off the $21 level from last August. This topping action may be somewhat drawn out as depicted by the refusal of the directional index (DI) components to do a bearish cross. |
|
| Figure 1: Disney. Disney's daily chart suggests a top may be in. |
| Graphic provided by: StockCharts.com. |
| |
| The indicators below the chart show multiple negative divergences to recent price action. When several indicators fail to confirm a price move that continues higher, the sustainability of the rise becomes doubtful. The volume signal also raises some doubt, as volume has not grown with the new highs, suggesting a lack of buying conviction. This lack of buying pressure is dramatically illustrated by the Chaikin money flow indicator. With such weak buying pressure, who will bid the stock higher? |
| Three downside targets are suggested, the nearest one being the 50-day exponential moving average (EMA), currently $26.31. The next possible support level relates to previous resistance at the 25.40 region. Previous resistance often becomes future support. Should this area not hold, the next support level would likely come from the often-watched 200-day EMA level, currently 24.54. Should the stock make a move above the previously discussed tweezer top, the bearish pattern would be negated and the bull run continue. |
Independent Canadian equities trader and technical analyst based in Peterborough
Ontario, Canada.
| Website: | www.whatsonsale.ca/financial.html |
| E-mail address: | gwg7@sympatico.ca |
Click here for more information about our publications!
Comments
Date:�12/28/04Rank:�5Comment:�
Date:�12/29/04Rank:�3Comment:�

Request Information From Our Sponsors
- StockCharts.com, Inc.
- Candle Patterns
- Candlestick Charting Explained
- Intermarket Technical Analysis
- John Murphy on Chart Analysis
- John Murphy's Chart Pattern Recognition
- John Murphy's Market Message
- MurphyExplainsMarketAnalysis-Intermarket Analysis
- MurphyExplainsMarketAnalysis-Visual Analysis
- StockCharts.com
- Technical Analysis of the Financial Markets
- The Visual Investor
- VectorVest, Inc.
- Executive Premier Workshop
- One-Day Options Course
- OptionsPro
- Retirement Income Workshop
- Sure-Fire Trading Systems (VectorVest, Inc.)
- Trading as a Business Workshop
- VectorVest 7 EOD
- VectorVest 7 RealTime/IntraDay
- VectorVest AutoTester
- VectorVest Educational Services
- VectorVest OnLine
- VectorVest Options Analyzer
- VectorVest ProGraphics v6.0
- VectorVest ProTrader 7
- VectorVest RealTime Derby Tool
- VectorVest Simulator
- VectorVest Variator
- VectorVest Watchdog