HOT TOPICS LIST
- MACD
- Fibonacci
- RSI
- Gann
- ADXR
- Stochastics
- Volume
- Triangles
- Futures
- Cycles
- Volatility
- ZIGZAG
- MESA
- Retracement
- Aroon
INDICATORS LIST
LIST OF TOPICS
PRINT THIS ARTICLE
by Gary Grosschadl
Dell has risen nicely since it vaulted past $36.50 in early November, but now it's looking to retrace.
Position: Sell
Gary Grosschadl
Independent Canadian equities trader and technical analyst based in Peterborough
Ontario, Canada.
PRINT THIS ARTICLE
CHART ANALYSIS
Dell Looking Toppy
12/21/04 08:59:25 AMby Gary Grosschadl
Dell has risen nicely since it vaulted past $36.50 in early November, but now it's looking to retrace.
Position: Sell
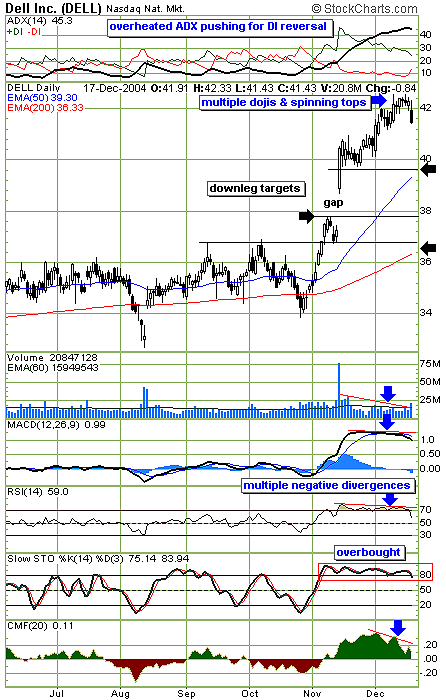
| After breaking above $42, several warning candlesticks have appeared hinting at a likely top. Within the cluster of six recent candlesticks, four can be considered a "warning." The two doji candlesticks (small crosses) and the two spinning tops (tiny bodies with tails on both ends) are often found at market tops. They show indecision on the part of traders, which often precludes a change in trend after a good rise. |
| Several indicators also seem to agree with this topping-out premise. The average directional movement (ADX) indicator at the top of the chart shows the ADX component appearing to peak while the DI components are quickly converging, likely leading to a bearish crossover. This configuration is typical of a trend change. The lower indicators (including volume) all show negative divergences to recent price action. When prices climb and indicators fail to follow suit or go down, trouble is often brewing concerning prices reversing after topping out. Particularily compelling is the obvious divergence on the Chaikin money flow indicator. This supply/demand indicator clearly shows buying pressure waning while the price continued to surge higher. If buyers are drying up, who will be left to further boost the price? The stochastics indicator shows that conditions have been overbought for some time, and now a downturn below the 80 level is apparently just starting. |

|
| Figure 1: Dell's daily chart shows downside possibilities. |
| Graphic provided by: StockCharts.com. |
| |
| Three downside targets are indicated by the black arrows. The first relating to a potential mid-candle support, close to the 50-period exponential moving average (EMA) line (39.30-39.60). The next target represents the gap that may be closed with a move to just under $38. Stocks often have the habit of "closing" their previous gaps before resuming their uptrend. Previous gaps tend to act as future support levels and traders may be targeting those levels. Should this gap not hold, then the next support level would be in the vicinity of the 200-day EMA and previous resistance of 36.80. |
| In summary, should the stock drift below the previous congestion area near $40, anticipate support or reversal likely between the 200-day EMA (currently 36.33) and the gap area, around $38. |
Independent Canadian equities trader and technical analyst based in Peterborough
Ontario, Canada.
| Website: | www.whatsonsale.ca/financial.html |
| E-mail address: | gwg7@sympatico.ca |
Click here for more information about our publications!
Comments
Date: 12/28/04Rank: 5Comment:

Request Information From Our Sponsors
- StockCharts.com, Inc.
- Candle Patterns
- Candlestick Charting Explained
- Intermarket Technical Analysis
- John Murphy on Chart Analysis
- John Murphy's Chart Pattern Recognition
- John Murphy's Market Message
- MurphyExplainsMarketAnalysis-Intermarket Analysis
- MurphyExplainsMarketAnalysis-Visual Analysis
- StockCharts.com
- Technical Analysis of the Financial Markets
- The Visual Investor
- VectorVest, Inc.
- Executive Premier Workshop
- One-Day Options Course
- OptionsPro
- Retirement Income Workshop
- Sure-Fire Trading Systems (VectorVest, Inc.)
- Trading as a Business Workshop
- VectorVest 7 EOD
- VectorVest 7 RealTime/IntraDay
- VectorVest AutoTester
- VectorVest Educational Services
- VectorVest OnLine
- VectorVest Options Analyzer
- VectorVest ProGraphics v6.0
- VectorVest ProTrader 7
- VectorVest RealTime Derby Tool
- VectorVest Simulator
- VectorVest Variator
- VectorVest Watchdog
