HOT TOPICS LIST
- MACD
- Fibonacci
- RSI
- Gann
- ADXR
- Stochastics
- Volume
- Triangles
- Futures
- Cycles
- Volatility
- ZIGZAG
- MESA
- Retracement
- Aroon
INDICATORS LIST
LIST OF TOPICS
PRINT THIS ARTICLE
by David Penn
Whether as support or resistance, trendlines can play more than one role in bull markets.
Position: N/A
David Penn
Technical Writer for Technical Analysis of STOCKS & COMMODITIES magazine, Working-Money.com, and Traders.com Advantage.
PRINT THIS ARTICLE
SUPPORT & RESISTANCE
Trendlines: From Support To Resistance
12/21/04 03:52:06 PMby David Penn
Whether as support or resistance, trendlines can play more than one role in bull markets.
Position: N/A
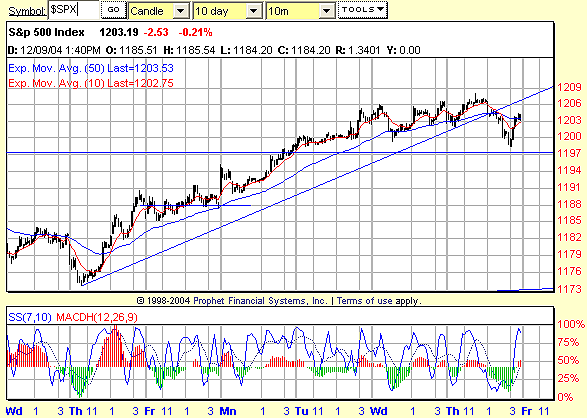
| As I wrote to myself early on Wednesday, December 8: "Part of the problem with the bull's advance since Thursday is that the angle of ascent appears too steep to be sustainable. So how do the bulls cope? Note how the uptrend line that has provided support since Thursday is now providing resistance. Yet that resistance appears to be actually beneficial to the bulls, moderating the advance by providing a temporary 'lid' on this morning's upmove. |
| "If the S&P 500 sets a new high, then the slope of the trendline will lessen to something just shy of 45 degrees. That makes for a far more sustainable advance--if it happens." |

|
| Figure 1: Wednesday sees the S&P 500 break down below trendline support in this 30-minute chart. Yet the S&P 500 continues to advance, using the trendline as a sort of "rolling resistance" higher. |
| Graphic provided by: Prophet Financial, Inc. |
| |
| That was my take at about 10:45 am. The fact that the Standard & Poor's 500 went on to close at or near the high of the day (which was also the high for the move) tends to support not only the theory of higher prices I proffered a few days ago ("Testing The Channel," December 10, 2004, Traders.com Advantage), but also today's notion that the resistance currently provided the S&P 500 is serving almost as a guide wire for the advance. |
| There is a developing negative stochastic divergence with the most recent peak. If confirmed by a break with follow-through to the downside, there remains the possibility of significant support at the 1200 level. What do I mean by confirmation? In a forthcoming article for Working-Money.com, I describe one way of playing stochastic divergences that provides for a confirmation point beyond which a trader can feel relatively confident about aggressively pursuing the reversal. For now, suffice it to say that I would need prices to fall to about 1201 from the late Wednesday's peak before I would be comfortable exiting the market--much less shorting this near-term top. |
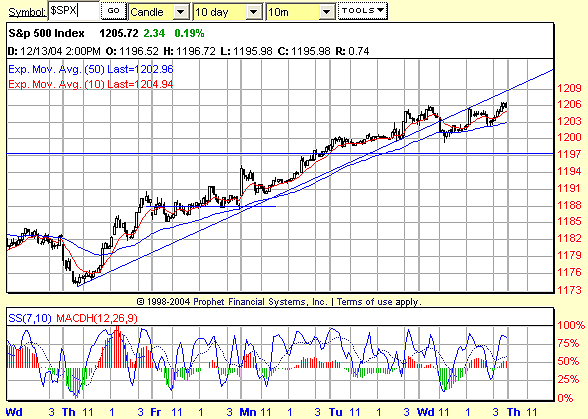
As it turned out, the market did not fall below 1201--at least not before making both a higher price high and a higher stochastic high mid-day Thursday. With this series of higher highs (the higher high on Wednesday and the even higher high on Thursday), the trendline that extends to the low immediately preceding the Tuesday peak is no longer valid and a new trendline must be drawn. See Figure 2. Figure 2: S&P 500 |
Technical Writer for Technical Analysis of STOCKS & COMMODITIES magazine, Working-Money.com, and Traders.com Advantage.
| Title: | Technical Writer |
| Company: | Technical Analysis, Inc. |
| Address: | 4757 California Avenue SW |
| Seattle, WA 98116 | |
| Phone # for sales: | 206 938 0570 |
| Fax: | 206 938 1307 |
| Website: | www.Traders.com |
| E-mail address: | DPenn@traders.com |
Traders' Resource Links | |
| Charting the Stock Market: The Wyckoff Method -- Books | |
| Working-Money.com -- Online Trading Services | |
| Traders.com Advantage -- Online Trading Services | |
| Technical Analysis of Stocks & Commodities -- Publications and Newsletters | |
| Working Money, at Working-Money.com -- Publications and Newsletters | |
| Traders.com Advantage -- Publications and Newsletters | |
| Professional Traders Starter Kit -- Software | |
Click here for more information about our publications!
Comments
Date: 12/28/04Rank: 3Comment:
Date: 12/29/04Rank: 4Comment:
Date: 12/30/04Rank: 3Comment:

Request Information From Our Sponsors
- StockCharts.com, Inc.
- Candle Patterns
- Candlestick Charting Explained
- Intermarket Technical Analysis
- John Murphy on Chart Analysis
- John Murphy's Chart Pattern Recognition
- John Murphy's Market Message
- MurphyExplainsMarketAnalysis-Intermarket Analysis
- MurphyExplainsMarketAnalysis-Visual Analysis
- StockCharts.com
- Technical Analysis of the Financial Markets
- The Visual Investor
- VectorVest, Inc.
- Executive Premier Workshop
- One-Day Options Course
- OptionsPro
- Retirement Income Workshop
- Sure-Fire Trading Systems (VectorVest, Inc.)
- Trading as a Business Workshop
- VectorVest 7 EOD
- VectorVest 7 RealTime/IntraDay
- VectorVest AutoTester
- VectorVest Educational Services
- VectorVest OnLine
- VectorVest Options Analyzer
- VectorVest ProGraphics v6.0
- VectorVest ProTrader 7
- VectorVest RealTime Derby Tool
- VectorVest Simulator
- VectorVest Variator
- VectorVest Watchdog
