HOT TOPICS LIST
- MACD
- Fibonacci
- RSI
- Gann
- ADXR
- Stochastics
- Volume
- Triangles
- Futures
- Cycles
- Volatility
- ZIGZAG
- MESA
- Retracement
- Aroon
INDICATORS LIST
LIST OF TOPICS
PRINT THIS ARTICLE
by Chris Manuell
The Pharmaceutical Index stalled the decline for 2004 in October and has developed a potential bullish ascending triangle.
Position: N/A
Chris Manuell
Chris Manuell spent 7 years as a futures sales/trader for a large investment bank and more recently as a technical analyst for an independent research company. He has a bachelor of economics and graduate diploma in applied finance & investment. Currently enrolled in the CMT program with the MTA.
PRINT THIS ARTICLE
ASCENDING TRIANGLES
Pharmaceutical Index Bullish Ascending Triangle
12/17/04 02:27:38 PMby Chris Manuell
The Pharmaceutical Index stalled the decline for 2004 in October and has developed a potential bullish ascending triangle.
Position: N/A
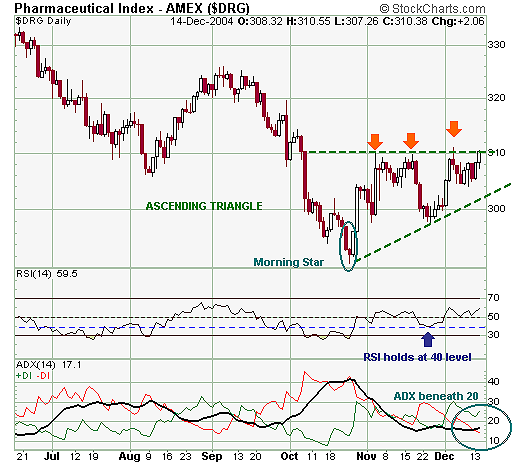
| The Pharmaceutical Index endured a tidy downtrend through 2004 before making a significant low on October 25. This low constituted a bullish morning star pattern in candlestick analysis. The first candle is a long dark candle as the bears sustain the prior down move. The second candle is marked by a small body as the open and close is within proximity and represents indecision as bears have struggled to maintain the weakness. The third white candle has a long body, which closes higher from the open and intrudes deeply into the first candles body. The morning star was confirmed the following session with a lengthy white body on October 27. |
| The Pharmaceutical Index has since attempted to reverse the downtrend, but it is struggling to complete a decisive penetration of the 310 region -- three failed attempts since November. This failure has allowed an ascending triangle to unfold as the horizontal resistance line has been matched by a rising bullish trendline. A decisive closing violation of the horizontal line in the 310 region would complete the pattern and result in a sharp rally. An objective from the ascending triangle can be calculated by taking the height of the pattern and adding that to the breakout point. Subtracting the lowest low from the highest high of the formation gives 19.33 (310.24 - 290.91). A decisive closing violation of 310.24 would enable a minimum objective of 329.57. |

|
| Figure 1: Daily Chart Pharmaceutical Index |
| Graphic provided by: StockCharts.com. |
| |
| The daily relative strength index (RSI) recently found support at the important 40 level -- an RSI support zone for markets in a bull market. This suggests that the Pharmaceutical Index is attempting to bounce and a push through the 65 RSI zone would support an evolving bullish market. The ADX is also poised for a sharp move as it remains beneath the 20 level, which is characteristic of a market that is coiling for an imminent sharp move. A simultaneous breach of the average directional movement index (ADX) 20 line and the triangles upper horizontal line would heighten the chances of the market meeting its minimum objective. Waiting for an upside breakout is imperative for these formations, as it decreases the failure rate of the pattern to 2% (as Thomas Bulkowski, author of ENCYCLOPEDIA OF CHART PATTERNS, would tell you). |
Chris Manuell spent 7 years as a futures sales/trader for a large investment bank and more recently as a technical analyst for an independent research company. He has a bachelor of economics and graduate diploma in applied finance & investment. Currently enrolled in the CMT program with the MTA.
| E-mail address: | chrismanuell5@yahoo.co.uk |
Click here for more information about our publications!
Comments
Date: 12/17/04Rank: 5Comment:
Date: 12/18/04Rank: 5Comment:
Date: 12/18/04Rank: 5Comment:
Date: 12/19/04Rank: 5Comment: Thank you. An excellent article for its clarity, brevity, completeness, and documentation. I am able to pay close attention and memorize the key points.

Request Information From Our Sponsors
- StockCharts.com, Inc.
- Candle Patterns
- Candlestick Charting Explained
- Intermarket Technical Analysis
- John Murphy on Chart Analysis
- John Murphy's Chart Pattern Recognition
- John Murphy's Market Message
- MurphyExplainsMarketAnalysis-Intermarket Analysis
- MurphyExplainsMarketAnalysis-Visual Analysis
- StockCharts.com
- Technical Analysis of the Financial Markets
- The Visual Investor
- VectorVest, Inc.
- Executive Premier Workshop
- One-Day Options Course
- OptionsPro
- Retirement Income Workshop
- Sure-Fire Trading Systems (VectorVest, Inc.)
- Trading as a Business Workshop
- VectorVest 7 EOD
- VectorVest 7 RealTime/IntraDay
- VectorVest AutoTester
- VectorVest Educational Services
- VectorVest OnLine
- VectorVest Options Analyzer
- VectorVest ProGraphics v6.0
- VectorVest ProTrader 7
- VectorVest RealTime Derby Tool
- VectorVest Simulator
- VectorVest Variator
- VectorVest Watchdog
