HOT TOPICS LIST
- MACD
- Fibonacci
- RSI
- Gann
- ADXR
- Stochastics
- Volume
- Triangles
- Futures
- Cycles
- Volatility
- ZIGZAG
- MESA
- Retracement
- Aroon
INDICATORS LIST
LIST OF TOPICS
PRINT THIS ARTICLE
by David Penn
A deep MACDH trough and a gap up above the 50-day EMA suggest higher prices ahead for the stock of this consumer noncyclical goods company.
Position: N/A
David Penn
Technical Writer for Technical Analysis of STOCKS & COMMODITIES magazine, Working-Money.com, and Traders.com Advantage.
PRINT THIS ARTICLE
CUP WITH HANDLE
Colgate's Cup With Handle Bottom
12/14/04 09:06:47 AMby David Penn
A deep MACDH trough and a gap up above the 50-day EMA suggest higher prices ahead for the stock of this consumer noncyclical goods company.
Position: N/A
| Cup with handle chart patterns have earned their popularity not just because of their effectiveness as chart patterns, but also because of the hearty endorsement bestowed upon them by everyone's favorite, all-American, hybrid (meaning both fundamental and technical) active investor, William O'Neil. Writing about cup with handle patterns in his book, HOW TO MAKE MONEY IN STOCKS, O'Neil wrote: "Major advances occur off sound price patterns and bases. Faulty base structures and completely obvious patterns that everyone sees bring failure ... One of the most fundamental chart-base price patterns looks like a cup with a handle when the outline of a cup is viewed from the side." |
| O'Neil's discussion deserves to be read in its entirety. Outside of Thomas Bulkowski's excellent observations about a sizable variety of chart patterns in his books (including his ENCYCLOPEDIA OF CHART PATTERNS), I can't think of another technician who has devoted as much time and attention to a single winning pattern. |

|
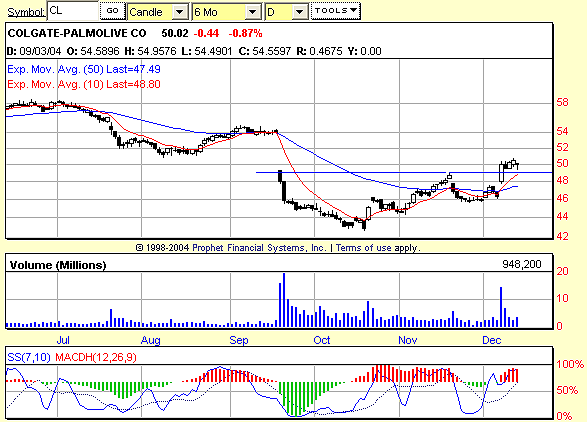
| Figure 1: A cup with handle pattern forms over the course of autumn 2004. Note the positive stochastic divergence that develops at the low point of the "cup" (compare September and October lows in price to like troughs in the 7,10 stochastic). |
| Graphic provided by: Prophet Financial, Inc. |
| |
| A number of interesting technical developments accompanied the formation of this cup with handle. First, the pattern itself is formed over the course of autumn 2004. The cup component of the pattern spans from mid-September to mid-November, and the handle component of the pattern lasts from mid-November until just before mid-December. Cup with handle patterns are often and most commonly seen as continuation patterns in a trend that has stalled. However, these same patterns can occur at market bottoms as part of a consolidation pattern as well. |
| The most impressive thing about this cup with handle is the breakout, fortunately enough. Not only does the breakout above resistance at roughly 49 do so on overwhelming volume, but also the stock gapped up at the open, suggesting a strong willingness among traders to bid up for shares. Note also that the 10-day exponential moving average (EMA) crossed above the 50-day EMA at the same time as the breakout--another bullish development. |
| What can traders expect in the way of upside from this breakout? The cup with handle pattern measures from about 43 near its October low and about 49 at its November high. Taking the difference between these two and adding it to the value at resistance provides for a minimum upside of about 55. Not coincidentally, a rally to the 55 area would close a sizable gap left over from the sharp, mid-September correction -- a correction that set the stage for the cup with handle bottom in the first place. |
Technical Writer for Technical Analysis of STOCKS & COMMODITIES magazine, Working-Money.com, and Traders.com Advantage.
| Title: | Technical Writer |
| Company: | Technical Analysis, Inc. |
| Address: | 4757 California Avenue SW |
| Seattle, WA 98116 | |
| Phone # for sales: | 206 938 0570 |
| Fax: | 206 938 1307 |
| Website: | www.Traders.com |
| E-mail address: | DPenn@traders.com |
Traders' Resource Links | |
| Charting the Stock Market: The Wyckoff Method -- Books | |
| Working-Money.com -- Online Trading Services | |
| Traders.com Advantage -- Online Trading Services | |
| Technical Analysis of Stocks & Commodities -- Publications and Newsletters | |
| Working Money, at Working-Money.com -- Publications and Newsletters | |
| Traders.com Advantage -- Publications and Newsletters | |
| Professional Traders Starter Kit -- Software | |
Click here for more information about our publications!
Comments
Date: 12/15/04Rank: 4Comment:

|

Request Information From Our Sponsors
- StockCharts.com, Inc.
- Candle Patterns
- Candlestick Charting Explained
- Intermarket Technical Analysis
- John Murphy on Chart Analysis
- John Murphy's Chart Pattern Recognition
- John Murphy's Market Message
- MurphyExplainsMarketAnalysis-Intermarket Analysis
- MurphyExplainsMarketAnalysis-Visual Analysis
- StockCharts.com
- Technical Analysis of the Financial Markets
- The Visual Investor
- VectorVest, Inc.
- Executive Premier Workshop
- One-Day Options Course
- OptionsPro
- Retirement Income Workshop
- Sure-Fire Trading Systems (VectorVest, Inc.)
- Trading as a Business Workshop
- VectorVest 7 EOD
- VectorVest 7 RealTime/IntraDay
- VectorVest AutoTester
- VectorVest Educational Services
- VectorVest OnLine
- VectorVest Options Analyzer
- VectorVest ProGraphics v6.0
- VectorVest ProTrader 7
- VectorVest RealTime Derby Tool
- VectorVest Simulator
- VectorVest Variator
- VectorVest Watchdog
