HOT TOPICS LIST
- MACD
- Fibonacci
- RSI
- Gann
- ADXR
- Stochastics
- Volume
- Triangles
- Futures
- Cycles
- Volatility
- ZIGZAG
- MESA
- Retracement
- Aroon
INDICATORS LIST
LIST OF TOPICS
PRINT THIS ARTICLE
by David Penn
How a bearish engulfing candlestick warned double-bottom bulls that the party was over.
Position: N/A
David Penn
Technical Writer for Technical Analysis of STOCKS & COMMODITIES magazine, Working-Money.com, and Traders.com Advantage.
PRINT THIS ARTICLE
CANDLESTICK CHARTING
The Trouble With THC's Double Bottom
12/14/04 08:46:17 AMby David Penn
How a bearish engulfing candlestick warned double-bottom bulls that the party was over.
Position: N/A
| Is there an uglier sight to wake up to than what unprotected owners of Tenet Healthcare stock found on their doorstep Monday morning? They say that it is "in space" where no one can hear you scream. But anybody who didn't hear the howling of THC bulls when their stock--which had surged higher on more than twice normal volume back near the beginning of the month--gapped down at Monday's open by a full point simply wasn't listening. |
| So please forgive any deployment of 20/20 hindsight here. But there was at least one major technical clue that would have alerted THC bulls to the dangers surrounding their stock as mid-December approached. And I can't help but believe that, hindsight or not, those who suffered through THC's sharp Monday setback are not likely to make the same mistake again. |

|
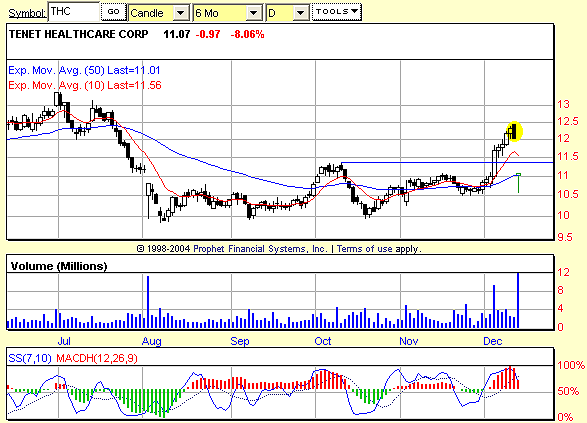
| Figure 1: A double bottom in THC fell short of its minimum upside projection by a few cents. But it was a bearish engulfing pattern that truly threatened the stock's advance. One day later, THC fell more than 8% on overwhelming volume. |
| Graphic provided by: Prophet Financial, Inc. |
| |
| The mistake? Ignoring the bearish engulfing pattern that formed on Friday, December 10. The bearish engulfing pattern are among the more significant and commonplace reversal patterns in candlestick analysis. Also referred to as a bearish, outside reversal day by bar-chart traders, the bearish engulfing pattern consists of two candlesticks and, as Steve Nison wrote in his book, BEYOND CANDLESTICKS, "is completed when, during a rally, a black real body envelopes a white real body." This "enveloping" is where the notion of "engulfing" comes from. And when this pattern appears in an extended trend, many traders see it as a high-reward/low-risk opportunity to take advantage of a reversal. Writing about their bar-chart brethren (the forementioned "bearish, outside reversal day"), Jon Markman, MSN Money contributing editor, noted that reversals following these patterns were so common that "many pros say they will trade them on blind faith." Markman adds, "if you look at recent history, you can see why." |
| Why, indeed. There is an argument that THC is "done going down." Note how, early in August, a similarly large volume day occurred as the stock gapped down on the open, but managed a strong intraday rally. This rally left the sort of long lower shadow (or tail) that, when combined with overwhelming volume and an extended trend, can mean a selling climax has occurred. The fact that THC was not able to close below the low of that "selling climax" day underscores the notion that the sellers exhausted themselves in that climatic move. |
| Does the gap down on December 13, a gap down that featured overwhelming volume and a long, lower shadow or tail, mean that sellers have again exhausted themselves? As with the drop in August, monitoring the pivot low created by today's action will be one of the more beneficial clues as to whether THC shares require merely a quick spin through the outpatient clinic, or if more intensive care is called for. |
Technical Writer for Technical Analysis of STOCKS & COMMODITIES magazine, Working-Money.com, and Traders.com Advantage.
| Title: | Technical Writer |
| Company: | Technical Analysis, Inc. |
| Address: | 4757 California Avenue SW |
| Seattle, WA 98116 | |
| Phone # for sales: | 206 938 0570 |
| Fax: | 206 938 1307 |
| Website: | www.Traders.com |
| E-mail address: | DPenn@traders.com |
Traders' Resource Links | |
| Charting the Stock Market: The Wyckoff Method -- Books | |
| Working-Money.com -- Online Trading Services | |
| Traders.com Advantage -- Online Trading Services | |
| Technical Analysis of Stocks & Commodities -- Publications and Newsletters | |
| Working Money, at Working-Money.com -- Publications and Newsletters | |
| Traders.com Advantage -- Publications and Newsletters | |
| Professional Traders Starter Kit -- Software | |
Click here for more information about our publications!
Comments
Date: 12/14/04Rank: 3Comment:

Request Information From Our Sponsors
- VectorVest, Inc.
- Executive Premier Workshop
- One-Day Options Course
- OptionsPro
- Retirement Income Workshop
- Sure-Fire Trading Systems (VectorVest, Inc.)
- Trading as a Business Workshop
- VectorVest 7 EOD
- VectorVest 7 RealTime/IntraDay
- VectorVest AutoTester
- VectorVest Educational Services
- VectorVest OnLine
- VectorVest Options Analyzer
- VectorVest ProGraphics v6.0
- VectorVest ProTrader 7
- VectorVest RealTime Derby Tool
- VectorVest Simulator
- VectorVest Variator
- VectorVest Watchdog
- StockCharts.com, Inc.
- Candle Patterns
- Candlestick Charting Explained
- Intermarket Technical Analysis
- John Murphy on Chart Analysis
- John Murphy's Chart Pattern Recognition
- John Murphy's Market Message
- MurphyExplainsMarketAnalysis-Intermarket Analysis
- MurphyExplainsMarketAnalysis-Visual Analysis
- StockCharts.com
- Technical Analysis of the Financial Markets
- The Visual Investor
