HOT TOPICS LIST
- MACD
- Fibonacci
- RSI
- Gann
- ADXR
- Stochastics
- Volume
- Triangles
- Futures
- Cycles
- Volatility
- ZIGZAG
- MESA
- Retracement
- Aroon
INDICATORS LIST
LIST OF TOPICS
PRINT THIS ARTICLE
by Kevin Hopson
Two bullish consolidation patterns not only support the possibility of higher prices, but they also make the scenario likely.
Position: Hold
Kevin Hopson
Kevin has been a technical analyst for roughly 10 years now. Previously, Kevin owned his own business and acted as a registered investment advisor, specializing in energy. He was also a freelance oil analyst for Orient Trading Co., a commodity futures trading firm in Japan. Kevin is currently a freelance writer.
PRINT THIS ARTICLE
TECHNICAL ANALYSIS
Are Long-Term Bond Prices Headed Higher?
12/14/04 08:58:51 AMby Kevin Hopson
Two bullish consolidation patterns not only support the possibility of higher prices, but they also make the scenario likely.
Position: Hold
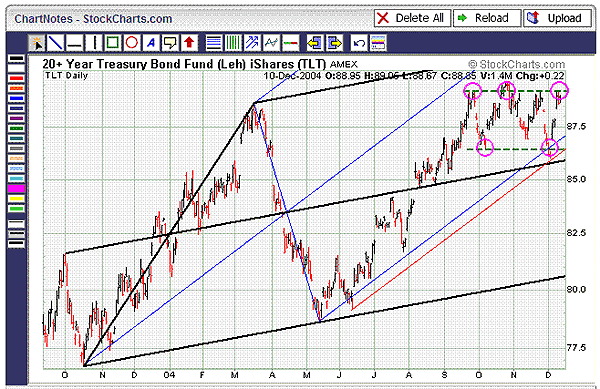
| It has been a while since I touched on the Lehman 20+ Year Treasury Bond Fund (TLT), but little has occurred over the past few months -- right? At first glance, we might get that impression. For example, prices have been trading sideways since mid-September, encountering resistance around the $90.00 level and finding support around the $86.50 level. Despite the lackluster trading recently, the long-term uptrend remains intact. |
| The reason I say this is because TLT continues to trade in the lower half of the blue pitchfork configuration (see Figure 1). Though prices slightly breached the bottom blue parallel line a couple of weeks ago, the sliding red parallel line (or warning line) from the June low held. In addition, the black median line -- which prices moved above in August -- and the 38.2% retracement ($85.50) from the May to October rally have also held up. As a result, it would take a break of key support in the $85.50 to $86.50 range for the technicals to turn bearish. |

|
| Figure 1: Lehman 20+ Year Treasury Bond Fund iShares |
| Graphic provided by: StockCharts.com. |
| |
| In the meantime, all signs point to higher prices. For example, as I mentioned earlier, TLT appears to be stuck in a trading range. Because trading ranges tend to act as continuation patterns and the long-term trend is positive, a break to the upside is likely. If so, prices could eventually make their way up to the $94.75 to $97.50 range. This assumes that prices will break the top channel line before testing the bottom channel line again. |
| I calculated this target by taking the number of times that prices will likely test the top channel line in alternate sequence before breaking out (3), multiplying this by the width of the trading range ($89.25-$86.50=$2.75) and then adding this figure ($2.75*3=$8.25) to the bottom ($86.50+$8.25=$94.75) and top ($89.25+$8.25=$97.50) channel lines. |
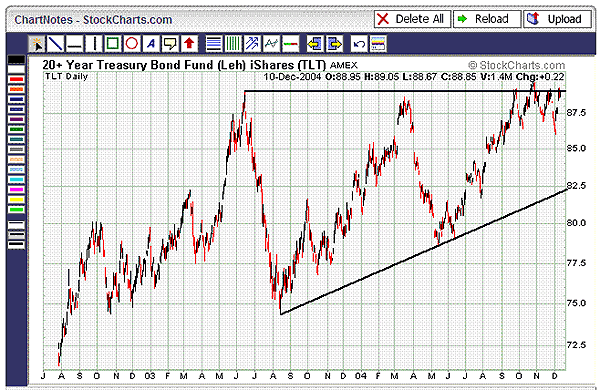
Not only that, the 30-month chart (Figure 2) shows an ascending triangle formation (bullish), which dates back to summer of last year. This pattern indicates a possible long-term upside target of $103. I calculated this price target by taking the base of the triangle (high point minus low point) and adding this figure ($89.00-$75.00=$14.00) to the potential breakout point ($89.00+$14.00=$103.00). As a result, shares of TLT could reach the mid-90s in the short to intermediate term and exceed $100 in the longer term. Given the potential for higher prices, I would continue to hold shares of TLT. Figure 2: 30-month chart. The chart shows a bullish ascending triangle formation, indicating a possible long-term upside target of $103. |
Kevin has been a technical analyst for roughly 10 years now. Previously, Kevin owned his own business and acted as a registered investment advisor, specializing in energy. He was also a freelance oil analyst for Orient Trading Co., a commodity futures trading firm in Japan. Kevin is currently a freelance writer.
| Glen Allen, VA | |
| E-mail address: | hopson_1@yahoo.com |
Click here for more information about our publications!
Comments
Date: 12/15/04Rank: 2Comment:
Date: 12/16/04Rank: 4Comment:
Date: 12/19/04Rank: 5Comment: Very clear and concise; the brevity presents the case for a subsequent demonstration by actual events. This is a very clear case for a demonstration as a proof.

|

Request Information From Our Sponsors
- StockCharts.com, Inc.
- Candle Patterns
- Candlestick Charting Explained
- Intermarket Technical Analysis
- John Murphy on Chart Analysis
- John Murphy's Chart Pattern Recognition
- John Murphy's Market Message
- MurphyExplainsMarketAnalysis-Intermarket Analysis
- MurphyExplainsMarketAnalysis-Visual Analysis
- StockCharts.com
- Technical Analysis of the Financial Markets
- The Visual Investor
- VectorVest, Inc.
- Executive Premier Workshop
- One-Day Options Course
- OptionsPro
- Retirement Income Workshop
- Sure-Fire Trading Systems (VectorVest, Inc.)
- Trading as a Business Workshop
- VectorVest 7 EOD
- VectorVest 7 RealTime/IntraDay
- VectorVest AutoTester
- VectorVest Educational Services
- VectorVest OnLine
- VectorVest Options Analyzer
- VectorVest ProGraphics v6.0
- VectorVest ProTrader 7
- VectorVest RealTime Derby Tool
- VectorVest Simulator
- VectorVest Variator
- VectorVest Watchdog
