HOT TOPICS LIST
- MACD
- Fibonacci
- RSI
- Gann
- ADXR
- Stochastics
- Volume
- Triangles
- Futures
- Cycles
- Volatility
- ZIGZAG
- MESA
- Retracement
- Aroon
INDICATORS LIST
LIST OF TOPICS
PRINT THIS ARTICLE
by Arthur Hill
Using the energy SPDR as an example, the stochastic oscillator can be used to identify oversold situations and opportunities to partake in the larger uptrend.
Position: Buy
Arthur Hill
Arthur Hill is currently editor of TDTrader.com, a website specializing in trading strategies, sector/industry specific breadth stats and overall technical analysis. He passed the Society of Technical Analysts (STA London) diploma exam with distinction is a Certified Financial Technician (CFTe). Prior to TD Trader, he was the Chief Technical Analyst for Stockcharts.com and the main contributor to the ChartSchool.
PRINT THIS ARTICLE
STOCHASTICS
Oversold Signals In Energy
12/13/04 01:14:29 PMby Arthur Hill
Using the energy SPDR as an example, the stochastic oscillator can be used to identify oversold situations and opportunities to partake in the larger uptrend.
Position: Buy
| Using the traditional settings, 14-day %K with a three-period smoothing and three-period %K, the stochastic oscillator is a short-term indicator that fluctuates between zero and 100. Because it is bound by zero and 100, the oscillator does not trend and eventually reverses as it approaches these extremes. Typically, an overbought situation arises when the oscillator moves above 80 and an oversold situation arises when the oscillator moves below 20. |
| In contrast to the stochastic oscillator, the 200-day simple moving average (SMA) is a long-term indicator that trends. This trend-following indicator is like a super-tanker that takes a relatively long time to turn and reverse. As long as a security is trading above its 200-day SMA and that 200-day SMA is rising, the long-term trend is generally considered bullish. |

|
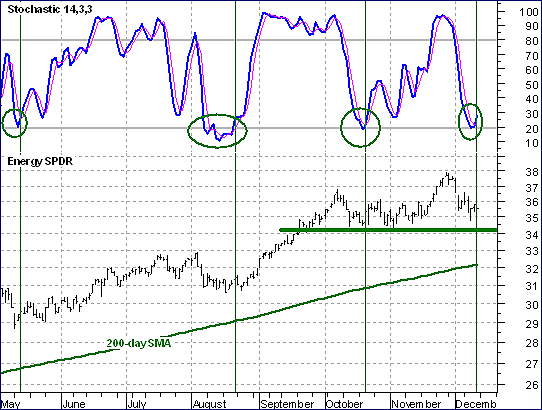
| Figure 1: Energy SPDR. Looking at the energy SPDR, we can see that the long-term trend is up as the stock is trading above its rising 200-day SMA. |
| Graphic provided by: MetaStock. |
| Graphic provided by: Reuters. |
| |
| Looking at the energy SPDR (XLE), we can see that the long-term trend is up as the stock is trading above its rising 200-day SMA. This tells us that long positions are preferred over short positions (trade with the trend). The stochastic oscillator can now be used to identify potential entry points. Because we are only interested in long positions, only oversold situations will be considered. Note that the stochastic oscillator has become oversold (below 20) four times since May (green ovals). A buy signal is generated when %K (blue line) moves above %D (magenta line). The stochastic oscillator has once again given a buy signal that will be in place as long as key support at 34 holds. |
Arthur Hill is currently editor of TDTrader.com, a website specializing in trading strategies, sector/industry specific breadth stats and overall technical analysis. He passed the Society of Technical Analysts (STA London) diploma exam with distinction is a Certified Financial Technician (CFTe). Prior to TD Trader, he was the Chief Technical Analyst for Stockcharts.com and the main contributor to the ChartSchool.
| Title: | Editor |
| Company: | TDTrader.com |
| Address: | Willem Geetsstraat 17 |
| Mechelen, B2800 | |
| Phone # for sales: | 3215345465 |
| Website: | www.tdtrader.com |
| E-mail address: | arthurh@tdtrader.com |
Traders' Resource Links | |
| TDTrader.com has not added any product or service information to TRADERS' RESOURCE. | |
Click here for more information about our publications!
Comments
Date: 12/14/04Rank: 4Comment:
Date: 12/15/04Rank: 5Comment:
Date: 12/19/04Rank: 5Comment: Very clear presentation. The article enables me to learn these complex relationships with confidence in their meanings and functions. I really appreciate all the writers for the education which they provide.

Request Information From Our Sponsors
- StockCharts.com, Inc.
- Candle Patterns
- Candlestick Charting Explained
- Intermarket Technical Analysis
- John Murphy on Chart Analysis
- John Murphy's Chart Pattern Recognition
- John Murphy's Market Message
- MurphyExplainsMarketAnalysis-Intermarket Analysis
- MurphyExplainsMarketAnalysis-Visual Analysis
- StockCharts.com
- Technical Analysis of the Financial Markets
- The Visual Investor
- VectorVest, Inc.
- Executive Premier Workshop
- One-Day Options Course
- OptionsPro
- Retirement Income Workshop
- Sure-Fire Trading Systems (VectorVest, Inc.)
- Trading as a Business Workshop
- VectorVest 7 EOD
- VectorVest 7 RealTime/IntraDay
- VectorVest AutoTester
- VectorVest Educational Services
- VectorVest OnLine
- VectorVest Options Analyzer
- VectorVest ProGraphics v6.0
- VectorVest ProTrader 7
- VectorVest RealTime Derby Tool
- VectorVest Simulator
- VectorVest Variator
- VectorVest Watchdog
