HOT TOPICS LIST
- MACD
- Fibonacci
- RSI
- Gann
- ADXR
- Stochastics
- Volume
- Triangles
- Futures
- Cycles
- Volatility
- ZIGZAG
- MESA
- Retracement
- Aroon
INDICATORS LIST
LIST OF TOPICS
PRINT THIS ARTICLE
by Gary Grosschadl
Taking a long-term view of the markets, I came to a surprising conclusion: The bull market that began more than two decades ago is not over, even though the sting of the year 2000 "meltdown" is still painfully etched in the minds of many traders and market followers.
Position: Buy
Gary Grosschadl
Independent Canadian equities trader and technical analyst based in Peterborough
Ontario, Canada.
PRINT THIS ARTICLE
ANDREWS PITCH-FORK
The Bull Market Is Not Over
12/13/04 10:20:21 AMby Gary Grosschadl
Taking a long-term view of the markets, I came to a surprising conclusion: The bull market that began more than two decades ago is not over, even though the sting of the year 2000 "meltdown" is still painfully etched in the minds of many traders and market followers.
Position: Buy
| Arguments and opinions that the bear market is not over can be heard from many sources. But we need to also consider opposing views in order to come up with a balanced slate of possibilities and probabilities. After all, that is the essence of the marketplace when it comes to intelligent analysis. Students of the markets are always weighing the options in this complex arena of possibilities and probabilities. A wise trader will consider both bullish and bearish scenarios, as what eventually transpires is not always what one expects, especially when emotions color perceptions. Chartists will see things most clearly after the fact, and that is the particular value of longer-term charts. Market noise often taints short-term charts, while the long-term view is much less affected. |
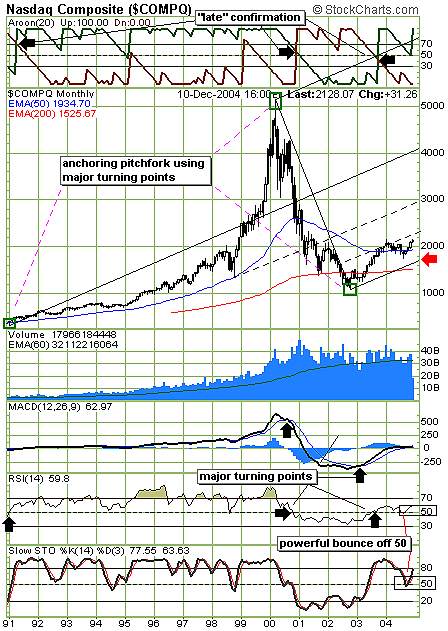
| A very large Andrews pitchfork (another tool of support and resistance) is drawn on this chart using three significant turning points, a low of 350 followed by a stunning rise to just above 5000 and then the dramatic fall to below 1200. The end result is a bullish pointing pitchfork that suggests that as long as the lower median line (red arrow) holds support, a bull run continues. A mainstay of pitchfork theory holds that there is an 80% probability of a successful move to the median line (center line), meaning an eventual move to the 4000-plus realm. Even if this attempt falls short, a move to a halfway point still entails a healthy rise to 3000. |

|
| Figure 1: A long-term pitchfork view of the Nasdaq. |
| Graphic provided by: StockCharts.com. |
| |
| Several indicators are used to show their confirmation of these major turning points, suggesting the last turning point at about 1200 may be just as significant as the others. The Aroon indicator is similar to the average directional movement index (ADX) I normally show on my charts. It helps determine the strength and direction of the current trend. Crossovers are a major bullish/bearish indication. Since 1990, there have only been three crossovers using a 20-period indicator setting. Since this is a somewhat slowly responding indicator, I look at these as "late" confirmations of a big turning point. This does suggest the third anchor of the pitchfork is a significant turning point. |
| The moving average convergence/divergence (MACD) indicator shows a quicker confirmation of the last two pitchfork turning points. These crossovers provided much more timely buy and sell signals even on this monthly chart. The relative strength index (RSI) shows similar signals by virtue of movements through the key 50 region. Note the recent bounce off this key 50 area of the two lower indicators. This is often signals a powerful move being launched out of a period of consolidation. |
| In summary, a bullish bias prevails by virtue of this Andrews pitchfork. A close below the lower median line would be a strong indication that a bearish trend change is under way, and until that happens the bulls are in charge. |
Independent Canadian equities trader and technical analyst based in Peterborough
Ontario, Canada.
| Website: | www.whatsonsale.ca/financial.html |
| E-mail address: | gwg7@sympatico.ca |
Click here for more information about our publications!
Comments
Date: 12/14/04Rank: 5Comment: I found your article interesting. It confirms my view of the market using a 200 month moving average. The 2000 - 2002 dip was a correction in a bullmarket and a buying opportunity. Note the upward slope of the 200 month MA.$COMPQ
Date: 12/14/04Rank: 4Comment:
Date: 12/19/04Rank: 5Comment: Very clear and introduces the Aeron indicator. It seems that using the two lines prior to their cross-overs provides a forewarning indicative function. Using three indicators together with the Andrews median line set and combining these with the Aerons indicator pair provides a high degree of confirmation in determining price action and entry/exit sites.

Request Information From Our Sponsors
- StockCharts.com, Inc.
- Candle Patterns
- Candlestick Charting Explained
- Intermarket Technical Analysis
- John Murphy on Chart Analysis
- John Murphy's Chart Pattern Recognition
- John Murphy's Market Message
- MurphyExplainsMarketAnalysis-Intermarket Analysis
- MurphyExplainsMarketAnalysis-Visual Analysis
- StockCharts.com
- Technical Analysis of the Financial Markets
- The Visual Investor
- VectorVest, Inc.
- Executive Premier Workshop
- One-Day Options Course
- OptionsPro
- Retirement Income Workshop
- Sure-Fire Trading Systems (VectorVest, Inc.)
- Trading as a Business Workshop
- VectorVest 7 EOD
- VectorVest 7 RealTime/IntraDay
- VectorVest AutoTester
- VectorVest Educational Services
- VectorVest OnLine
- VectorVest Options Analyzer
- VectorVest ProGraphics v6.0
- VectorVest ProTrader 7
- VectorVest RealTime Derby Tool
- VectorVest Simulator
- VectorVest Variator
- VectorVest Watchdog
