HOT TOPICS LIST
- MACD
- Fibonacci
- RSI
- Gann
- ADXR
- Stochastics
- Volume
- Triangles
- Futures
- Cycles
- Volatility
- ZIGZAG
- MESA
- Retracement
- Aroon
INDICATORS LIST
LIST OF TOPICS
PRINT THIS ARTICLE
by Gary Grosschadl
This gold index may be at a crossroads. Is a bigger downleg developing or is this current dip just a normal and healthy retracement?
Position: N/A
Gary Grosschadl
Independent Canadian equities trader and technical analyst based in Peterborough
Ontario, Canada.
PRINT THIS ARTICLE
CHART ANALYSIS
Golden Bull Or Golden Bear?
12/13/04 10:07:38 AMby Gary Grosschadl
This gold index may be at a crossroads. Is a bigger downleg developing or is this current dip just a normal and healthy retracement?
Position: N/A
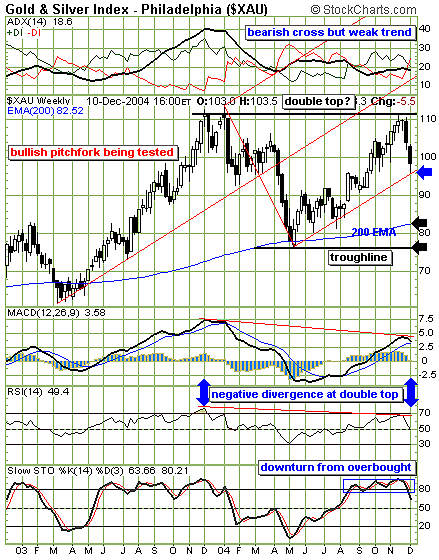
| On this weekly gold index chart, two patterns have possibilities. One is a possible double-top consideration. If this is correct, a test of the troughline could occur. A double top is confirmed once the troughline is broken to the downside. A mere test of this lower line would already be a larger move for a short-term trader. Should the double top be confirmed with a sustainable move below the troughline, the fulfillment target would be 33 points lower (the distance between the double top and the troughline). This does not mean that it will go that far, just that it is possible, according to the pattern target. Note the location of the 200-period exponential moving average (EMA), currently 82.52. This lesser target is also a downside possibility, as this closely watched moving average could come into play. |
| The second possibility lies in the bull camp, as outlined by a bullish pointing pitchfork. Pitchfork theory (more correctly called the Andrews line after the originator, Alan Andrews) says the uptrend remains intact as long as the lower median line holds support. Last summer, this line was tested several times, as shown by the long lower shadows (tails); however, the uptrend remained intact. Last week, this line was again tested. A close below this line would suggest the pitchfork pattern will fail and the uptrend is over. The pitchfork is anchored by three major turning points. If this pitchfork ends, then a new one is drawn using the latest turning point. From experience, this subsequent pattern will point downward -- that is, a bearish pointing pitchfork. |

|
| Figure 1: Gold & Silver Index. Note the pattern possibilities on this weekly chart. |
| Graphic provided by: StockCharts.com. |
| |
| The indicators on Figure 1 suggest more downside is ahead, especially the stochastic downturn from overbought levels. Note the negative divergences for the moving average convergence/divergence (MACD) and the relative strength index (RSI). Whether this leads to the bear camp remains to be seen. |
Independent Canadian equities trader and technical analyst based in Peterborough
Ontario, Canada.
| Website: | www.whatsonsale.ca/financial.html |
| E-mail address: | gwg7@sympatico.ca |
Click here for more information about our publications!
Comments
Date: 12/14/04Rank: 5Comment:
Date: 12/16/04Rank: 4Comment:

Request Information From Our Sponsors
- VectorVest, Inc.
- Executive Premier Workshop
- One-Day Options Course
- OptionsPro
- Retirement Income Workshop
- Sure-Fire Trading Systems (VectorVest, Inc.)
- Trading as a Business Workshop
- VectorVest 7 EOD
- VectorVest 7 RealTime/IntraDay
- VectorVest AutoTester
- VectorVest Educational Services
- VectorVest OnLine
- VectorVest Options Analyzer
- VectorVest ProGraphics v6.0
- VectorVest ProTrader 7
- VectorVest RealTime Derby Tool
- VectorVest Simulator
- VectorVest Variator
- VectorVest Watchdog
- StockCharts.com, Inc.
- Candle Patterns
- Candlestick Charting Explained
- Intermarket Technical Analysis
- John Murphy on Chart Analysis
- John Murphy's Chart Pattern Recognition
- John Murphy's Market Message
- MurphyExplainsMarketAnalysis-Intermarket Analysis
- MurphyExplainsMarketAnalysis-Visual Analysis
- StockCharts.com
- Technical Analysis of the Financial Markets
- The Visual Investor
